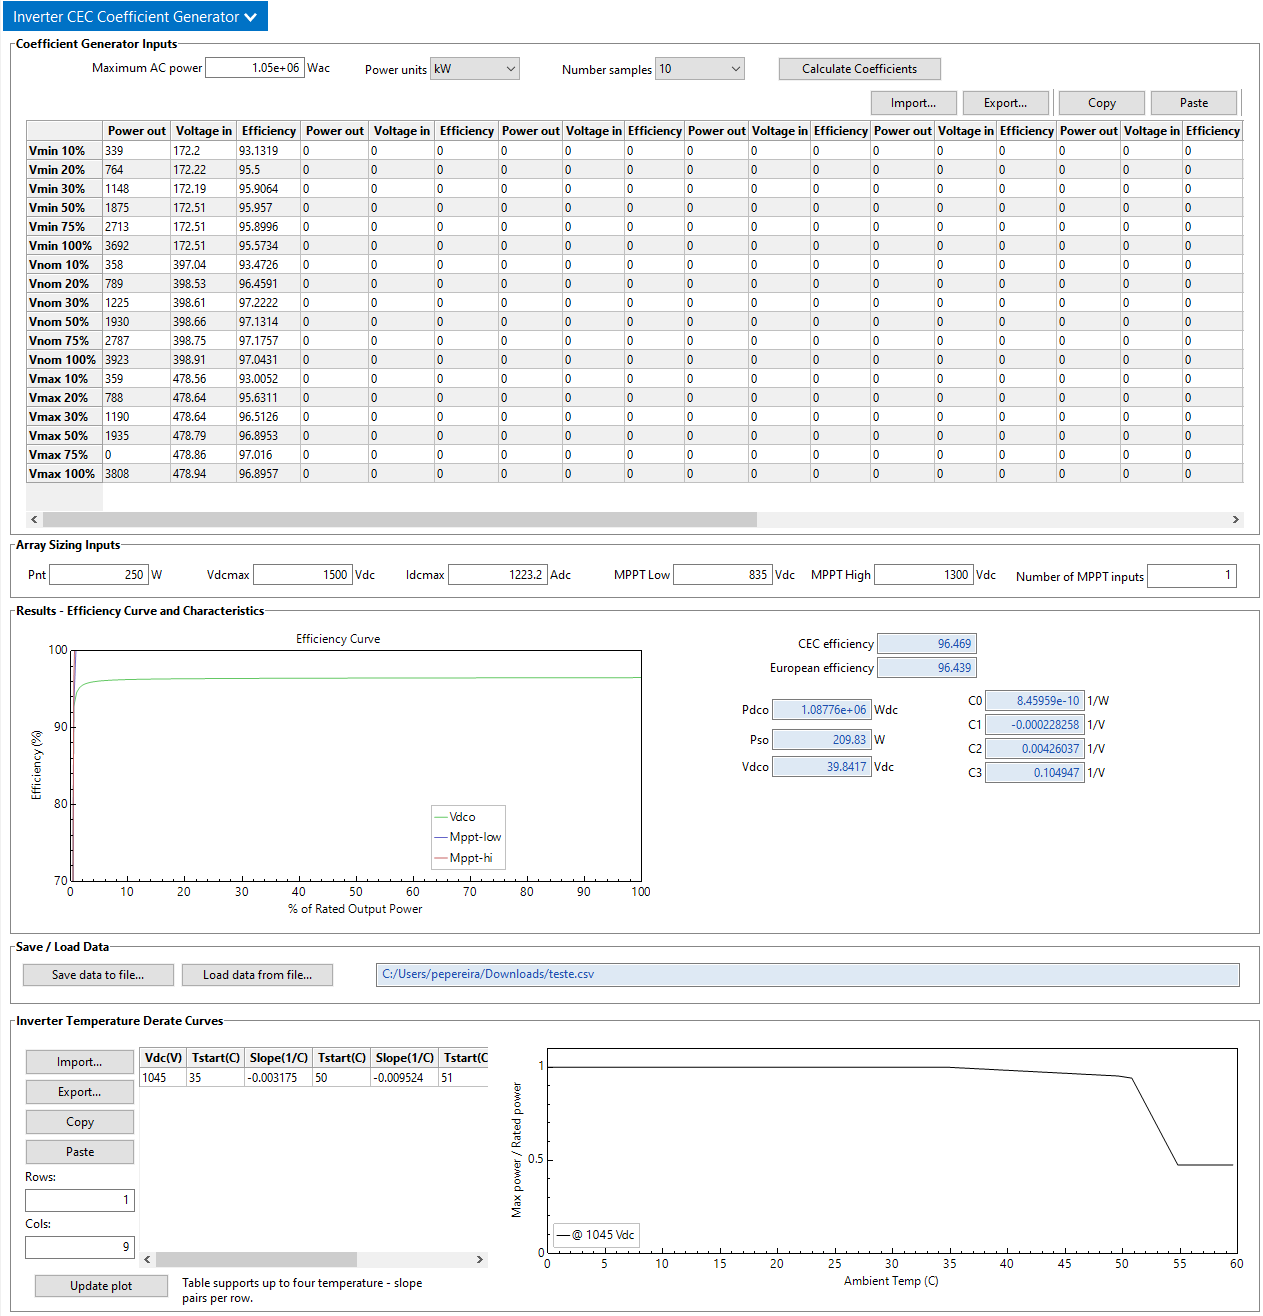
Create custom inverter on PVlib: GE 1500V 1.1MW inverter (LV5-1511-30-IEC-SLR)

202 views
Skip to first unread message

Pedro

unread,
Sep 2, 2022, 10:30:53 AM9/2/22
to pvlib-python
How can I create a custom inverter inside PVlib? I've searched on "CEC Inverter" and "Sandia Inverter", "ADR Inverter" databases but I couldn't find the one I'm looking for: "GE 1500V 1.1MW inverter (LV5-1511-30-IEC-SLR)". How can I input it inside pvlib? I have its datasheet but I'm not sure how I can define some parameters such as CO, C1, C2, etc.

Any help is much appreciated. Thank you in advance!

Will Hobbs

unread,
Sep 2, 2022, 12:05:35 PM9/2/22
to pvlib-python
I've never tried this myself, but you might look at the CEC Coefficient Generator in NREL SAM (make sure to review the related help docs in SAM, they are almost always helpful). You might be able to generate coefficients, copy/export from SAM, and then use them in pvlib. 

Will

Pedro

unread,
Sep 2, 2022, 3:07:06 PM9/2/22
to pvlib-python
Hey Will, thanks for your reply! I was trying to do as you suggested but when I fill in the specs for my inverter, the resulting curves seems kind of odd. The efficiency curve (specially the MPPT ones) end up having a bizarre behaviour and, also, the final efficiency don't match with the ones stated in the datasheet.

I don't have the first table in my datasheet to tune in the values and it seems that filling in the rest of information isn't enough to have solid coefficients.

I'll try to look for another way to do this

cec coeff_example.png

Pedro

unread,
Sep 2, 2022, 4:49:53 PM9/2/22
to pvlib-python
Does anyone knows if its strictly necessary to have coefficients C0, C1, C2 and C3 in order to simulate energy, losses, etc.? Also, is there any other model that's easier to input on pvlib than this one?

I have .OND file and inverter's datasheet, so I'm wondering if there isn't really another way to input those informations and build my system without counting with this current model.

cwh...@sandia.gov

unread,
Sep 2, 2022, 4:57:14 PM9/2/22
to pvlib-python
Pedro,

The pvlib-python function pvlib.inverter.fit_sandia is likely to return useful coefficients for the Sandia inverter function. Sample code below. I get strange efficiency curves because of issues with the data in the screenshot above:
- you need to fill in the Ac power at Vmax@75% (or drop this row).
- the inverter maximum AC power (rating) is entered as 1,050kW but the data show this is a 4MW inverter?
- the measured voltages indicate a 600Vdc inverter but the Vdc range is for a 1500Vdc system.

Feel free to DM me at cwhanse(at)sandia.gov. I'd like to understand how to improve the interface for the pvlib function if it is problematic.

Cheers,

Cliff

import numpy as np
import pandas as pd
import pvlib
import matplotlib.pyplot as plt


ac_power = np.array([339., 764., 1148., 1875., 2713., 3692.,
                     358., 789., 1225., 1930., 2787., 3923.,
                     359., 788., 1190., 1935., np.nan, 3808.]) * 1000  # Watts
effic = np.array([93.1319, 95.5, 95.9064, 95.957, 95.8996, 95.5734,
                  93.4726, 96.4591, 97.2222, 97.1314, 97.1757, 97.0431,
                  93.0052, 95.6311, 96.5126, 96.8953, 97.016, 96.8957])  # percent
dc_power = ac_power / (effic / 100.)
dc_voltage = np.array([172.2, 172.22, 172.19, 172.51, 172.51, 172.51,
                       397.04, 398.53, 398.61, 398.66, 398.75, 398.91,
                       478.56, 478.64, 478.64, 478.79, 478.86, 478.94])

dc_voltage_level = ['Vmin']*6
dc_voltage_level.extend(v for v in ['Vnom']*6)
dc_voltage_level.extend(v for v in ['Vmax']*6)
dc_voltage_level = np.array(dc_voltage_level)

names = ['ac_power', 'dc_power', 'dc_voltage', 'dc_voltage_level']
data = pd.DataFrame.from_dict(dict(zip(names, [ac_power, dc_power, dc_voltage, dc_voltage_level])))

data.dropna(inplace=True)

p_ac_0 = 1050000  # Watts
p_nt = 250  # Watts
params = pvlib.inverter.fit_sandia(
    data['ac_power'], data['dc_power'], data['dc_voltage'],
    data['dc_voltage_level'], p_ac_0, p_nt)

sim = pvlib.inverter.sandia(data['dc_voltage'], data['dc_power'], params)
eff = sim / data['dc_power'] * 100

plt.figure()
for v in ['Vmin', 'Vnom', 'Vmax']:
    x = sim[data['dc_voltage_level']==v] / p_ac_0 * 100
    y = eff[data['dc_voltage_level']==v]

    plt.plot(x, y, label=v)
plt.legend(['Vmin', 'Vnom', 'Vmax'])

Pedro

unread,
Sep 2, 2022, 5:18:57 PM9/2/22
to pvlib-python
Hey Cliff,

Thanks for your answer! Yeah, sorry but I forgot to mention that the table was automatically filled as soon as I updated the "Maximum AC power". I don't have the study's data to fill in the table (and I'm not aware of any manufacturers that offers this to their clients also!)

So what I did was to fill the sections below the table: "Array Sizing Inputs" and "Inverter Temperature Derate Curves" because those informations I have from the datasheet.

So I'm kinda lost here because it seems that those coefficients are 100% dependent from the 1st table but I don't have this information. 

cwh...@sandia.gov

unread,
Sep 2, 2022, 5:41:31 PM9/2/22
to pvlib-python
I assumed that you had to enter that data into SAM.  I guess I should look at the SAM code and see what it is actually doing.

What data do you have? If you have the inverter spec sheet, does it show efficiency curves that could be digitized? Unfortunately, the coefficient generator requires something like the data shown in the SAM table. The only alternative is to use the pvlib.inverter.pvwatts function, which is intended for residential inverters.

Cliff

Pedro

unread,
Sep 2, 2022, 11:39:24 PM9/2/22
to pvlib-python

Hey Cliff,

Thank you for your time once again! Yes, unfortunately I saw that many examples already inside the libraries seems to be micro inverters... I do have some curves (not only efficiency ones but also derating and some more due to .OND) but it seems that is a bit more difficult to add this inverter to pvlib than I thought.

Many thanks once again.

Pedro

Anton Driesse

unread,
Sep 3, 2022, 4:07:40 AM9/3/22
to pvlib-...@googlegroups.com

Hi Pedro,

There are some functions for fitting the ADR model in:

https://github.com/adriesse/pvpltools-python/blob/master/pvpltools/power_conversion.py

Currently it is geared toward just translating the SAPM parameters, but the translation goes via a table of values.  If you run the function "create_cec_matrix_sandia" you'll see the format needed for this table.  Then just substitute your data into that table structure and run the tail end of the function "fit_adr_to_sandia" (the portion after the call to "create_cec_matrix_sandia".

Anton

--
You received this message because you are subscribed to the Google Groups "pvlib-python" group.
To unsubscribe from this group and stop receiving emails from it, send an email to pvlib-python...@googlegroups.com.
To view this discussion on the web visit https://groups.google.com/d/msgid/pvlib-python/32546602-8968-4a40-b571-3b99a84d2cd6n%40googlegroups.com.
-- 
Photovoltaic Performance Labs Germany
Emmy-Noether-Str. 2
79110 Freiburg
Germany

+49-761-8973-5603 (Office)
+49-174-532-7677 (Mobile)

www.pvperformancelabs.com

Pedro

unread,
Sep 3, 2022, 4:08:14 PM9/3/22
to pvlib-python
Hello Anton,

Thank you for your time. In order to run "create_cec_matrix_sandia" I need my inverter object already defined, right? Are you suggesting that I manually create this inverter object without ADRCoefficients, only with the information I have on datasheet, and then run "fit_adr_to_sandia", to finally have ADRCoefficients?

Just to be clear, the table from CEC Coefficient Generator in my previous print is not realistic. Those are random values that were automatically generated by SAM, only "Array Sizing Inputs" and "Inverter Temperature Derate Curves" have real values.

Pedro

Anton Driesse

unread,
Sep 4, 2022, 7:56:54 AM9/4/22
to pvlib-...@googlegroups.com

Hi Pedro,

Sorry, I was not completely clear.  You can run "create_cec_matrix_sandia" using any inverter from the database to see what the data structure is.  Then replicate this data structure using the information you have.  (You wrote: "I do have some curves", so I am assuming you have what you need for this.)

Anton

To view this discussion on the web visit https://groups.google.com/d/msgid/pvlib-python/c6bb4845-8113-4367-a967-2e8559be2cd9n%40googlegroups.com.
-- 
PV Performance Labs Germany
Emmy-Noether-Str. 2
79110 Freiburg
Germany

salazar...@gmail.com

unread,
Oct 8, 2022, 1:11:24 PM10/8/22
to pvlib-python
Hello, I hope everyone is well.

I also have an .OND file like Pedro, from there I took the data of three curves that appear in the sections ProfilPIOV1=TCubicProfile (although I don't know what they are, it seems to me that they are DC and AC power data, respectively), and I tried to adjust these values to the code that Cliff shared with us. I attached the.OND file and code.

___
n = 6
dc_voltage_level = ['Vmin']*n
dc_voltage_level.extend(v for v in ['Vnom']*n)
dc_voltage_level.extend(v for v in ['Vmax']*n)
dc_voltage_level = dc_voltage_level

dict2 = {
    'dc_power': np.array([87520.0, 172720.0, 343090.0, 513280.0, 854520.0, 1282560.0,
                          88160.0, 173310.0, 343860.0, 515790.0, 856510.0, 1285160.0,
                          89060.0, 174070.0, 344670.0, 515210.0, 857730.0, 1286600.0]),
   
    'ac_power': np.array([84439.3, 168868.3, 337737.8, 506607.4, 844351.2, 1266528.0,
                          84439.6, 168873.3, 337739.3, 508001.6, 844347.6, 1266525.2,
                          84437.8, 168865.3, 337742.1, 506606.0, 844349.4, 1266529.0]),
   
    'dc_voltage': [939.0, 939.0, 939.0, 939.0, 939.0, 939.0,
                   1061.0, 1061.0, 1061.0, 1061.0, 1061.0, 1061.0,
                   1170.0, 1170.0, 1170.0, 1170.0, 1170.0, 1170.0],
   
    'dc_voltage_level': dc_voltage_level
}

p_ac_0 = 1520*1000  # Watts
p_nt = 90.00  # Watts

data = pd.DataFrame(dict2)

params = pvlib.inverter.fit_sandia(ac_power=data['ac_power'],
                                   dc_power=data['dc_power'],
                                   dc_voltage=data['dc_voltage'],
                                   dc_voltage_level=data['dc_voltage_level'],
                                   p_ac_0=p_ac_0,
                                   p_nt=p_nt)

___

What causes me doubt is that the results of the Pdco and Pso parameters are not what I expected according to the .OND file, and therefore I do not know if the parameters C0, C1, C2 and C3 are correct. Is there any way I can do this validation?

Thanks in advance.

Nelson A. Salazar Pena

Ingeteam_INGECONSUN1690TLB650OUTDOOR.ond

cwh...@sandia.gov

unread,
Oct 10, 2022, 11:34:30 AM10/10/22
to pvlib-python
Hi Nelson,

I don't know how to interpret the entries in the OND file; which values correspond to the Pdco and Pso parameters?  Note that Pso is not the same as Pnt. Pso is a fitted parameter that represents the "start-up" power, which is where the curve fit to the nominal DC power vs. AC power data intersects the y-axis (at 0 AC power).

You can check the model's agreement with data by plotting observed and predicted values. I'm used to doing that with efficiency rather than AC power. Example code below. Do you think a plotting function like this would be of value in pvlib?

Cheers,

Cliff


import numpy as np
import pandas as pd
import pvlib
import matplotlib.pyplot as plt


def compare_efficiency(data):
    fig = plt.figure()
    labels = []
   
    for v in np.unique(data['dc_voltage']):
        labels.append(str(v) + "V")
        labels.append('')
        u = data['dc_voltage'] == v
        p = plt.plot(data['dc_power'][u], data['eff'][u] * 100, '.')
        plt.plot(data['dc_power'][u], data['pred_eff'][u] * 100,
                 color=p[0].get_color())
   
    labels = labels[0:-1:2]
    plt.xlabel('Total DC power (W)')
    plt.ylabel('Efficiency (%)')
    plt.legend(labels, loc='lower center', ncol=3)
    plt.tight_layout()
    return fig
data['pred_ac_power'] = pvlib.inverter.sandia(data['dc_voltage'], data['dc_power'], params)
data['eff'] = data['ac_power'] / data['dc_power']
data['pred_eff'] = data['pred_ac_power']  / data['dc_power']

fig = compare_efficiency(data)
fig.show()

salazar...@gmail.com

unread,
Oct 10, 2022, 4:23:55 PM10/10/22
to pvlib-python
Hi Cliff, thanks for your response and for taking the time.

I'm taking Pdco = PNomDC*1000 and Pso = Pthresh or Pso = 1% of Pdco (per PVsyst documentation here). Also, according to this PVsyst documentation, I understand that the curve I mentioned is the DC Power vs AC Power (they use it to calculate the inverter efficiency). I am taking Pso = 0.5% of Pdco (i.e., 8615 W) and the function fit_sandia indicates a value of 3219 W. It seems to me that for the capacity of the inverter this result is good, but I do not have metrics to say it with certainty.

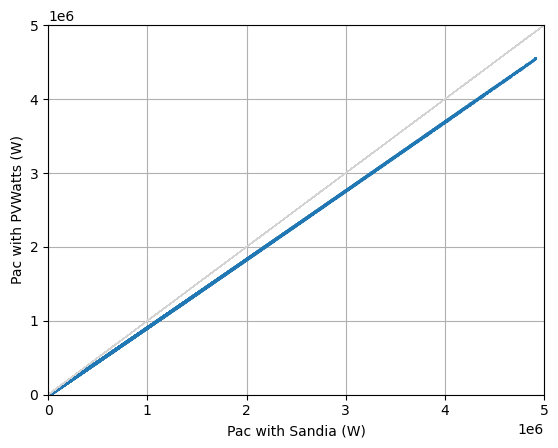
Unfortunately I do not have real data to check, but attached I share a curve where I compare the results between Sandia's AC model and NREL PVWatts. The results show that with Sandia the values ​​are lower, and that is also expected. For example, I got these statistical metrics:

Pac_Comparative.png

Pac_table.png

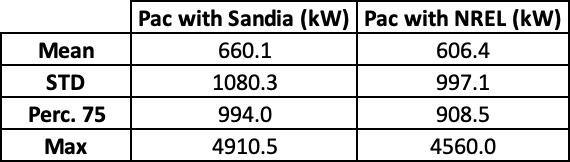
Does this look like a good result or may I be missing something?

Thanks for sharing the code for the plot of efficiency vs DC power, it is excellent and I also see it according to the nominal values ​​of the .OND file. I think it is useful to have this function in pvlib or to have it available in an example, because it is not easy for an agent to have the information obtained from this plot (agents would have to ask the manufacturer for it and I am not sure that they have it easily available either). It can also help to understand the operation of the inverter from the weighted efficiency calculation by viewing these curves.

Nelson A. Salazar Peña

Pac_Comparative.png

cwh...@sandia.gov

unread,
Oct 10, 2022, 5:28:52 PM10/10/22
to pvlib-python
Hi Nelson,

I think Pvsyst's guess of Pso = 1% of Pdco is just that: a way to fill in a number when you have no other information. These values (Pso either for the Sandia fitted model, or Pvsyst guess) won't have much effect on an energy calculation. It looks like Pvsyst PnomDC is related to clipping during operations. Sandia's Pdco is the DC power that produces the rated AC output power at nominal DC voltage. I don't know why, in this case, Pvsyst OND file has such a high value for the DC clipping power (1723 kW for a 1520 kWAC inverter). The DC and AC power data suggest efficiency of 98.5% at high DC power, which is why the fitted Pdco is 1543 (1520 / 0.985). 

The difference you show between Sandia and PVWatts is wider than I'd expect, assuming you left the PVWatts at default efficiency (0.96). At high power, the Sandia efficiency of 0.985 points to a difference of 1.5% in AC power output, that chart looks more like 10% to me.

Cheers,

Cliff

salazar...@gmail.com

unread,
Oct 10, 2022, 6:08:16 PM10/10/22
to pvlib-python
Hi Cliff.

Ok, thanks for the clarification. I will check because other tests I have done agree with the approximate 1.5% difference you mention. It could also be due to the values in the .OND file, some of them also seem strange to me. Any news I will tell you.

The good news is that it does seem possible (and feasible) to estimate the parameters C0, C1, C2 and C3 from an .OND file.

Thanks again for all your help.

Nelson A. Salazar Peña

Orçun Başlak

unread,
Apr 26, 2023, 2:28:15 PM4/26/23
to pvlib-python
Dear all,

I've been working on PVLIB with PVSYST inverter files however I came to a point where the data from OND file calculates the inverter output power lower than what PVSYST and PVLIB using CEC variables calculates.

I selected an inverter that exists both in CEC database and PVSYST database in order to compare correctly.

1. For fit_sandia function, I used the curves available in OND file. OND file has 3 curves defined for Vmin, Vnom and Vmax
2. For ADR inverter function, I used the data in the OND file (not the curves). ADR has a create_cec_matrix_sandia function. ADR also uses _sandia_eff internally.
3. I used the C0, C1, C2 and C3 parameters from the CEC inverter database.
4. For PVSYST I have hourly CSV data imported.

inverter.sandia and inverter.adr functiones created very close values but they are far from PVSYST (~8.2%) and the results using CEC website values. I think this is because fit ADR is based on sandia_eff.

#######
Inverter AC Output (PVLIB_FIT_SANDIA) : 70,208.8kWh
#######
#######
Inverter AC Output (SANDIA_DATABASE) : 76,522.8kWh
#######
#######
Inverter AC Output (PVSYST) : 76,672.5kWh
#######
#######
Inverter AC Output (ADR) : 70,155.1kWh 
#######

I think the issue is with the interpretation of the curves (deriving efficiency from the curves).


It gets messy at the end so sorry for the mess.

Best,

Michael Morris

unread,
Apr 30, 2023, 3:53:37 PM4/30/23
to Orçun Başlak, pvlib-python
For the first method, what values did you use for the p_ac_0 and p_nt parameters?

Reply all
Reply to author
Forward
0 new messages