Prometheus Growth
30 views
Skip to first unread message

Julio Leal
Nov 21, 2022, 1:09:22 AM11/21/22
to Prometheus Users
Hi everyone!


I'm doing a study about how much time we have in our prometheus instances.
First of all, I thought that prometheus memory grew because number timeseries ingested. I thought like this because timeseries stay in memory to recover informations more faster.
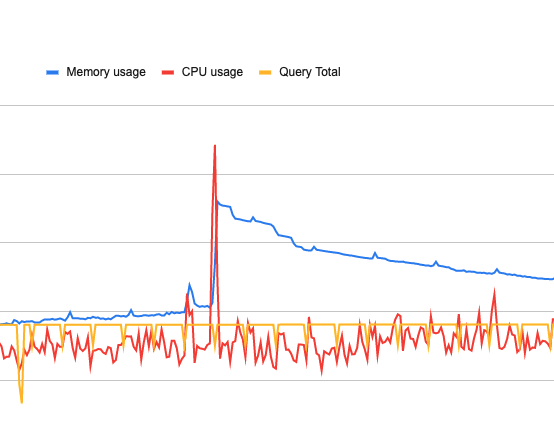
But I got timeseries from last 3 months and I found that my timeseries ingested was grew little, like this graph and in the same time, I needed to increase the memory ram and CPU of the our instances sometimes.
First of all, I thought that prometheus memory grew because number timeseries ingested. I thought like this because timeseries stay in memory to recover informations more faster.
But I got timeseries from last 3 months and I found that my timeseries ingested was grew little, like this graph and in the same time, I needed to increase the memory ram and CPU of the our instances sometimes.
After that I used query log to get queries on prometheus server and I got execTotalTime and timestamp and got amount queries in between two dates (10 minutes, 5 minutes, 1 hour). I also got sum and average of the queries spend time between of the same dates, like this graph:
With that I discovered that my record rules did my amount queries stay almost the same.
I isolated queries of the record rules from web view the difference.
When I did this, the amount of metrics changed, but the memory usage doesn't kept up with growth of the queries.
My question here is. What can I consider to mensure memory and/or CPU usage growth on prometheus server? Timeseries, queries or another factor that I am not considering?
Thank you!

Stuart Clark
Nov 21, 2022, 3:25:52 AM11/21/22
to Julio Leal, Prometheus Users
On 20/11/2022 22:53, Julio Leal wrote:
> Hi everyone!
> I'm doing a study about how much time we have in our prometheus instances.
> First of all, I thought that prometheus memory grew because number
> timeseries ingested. I thought like this because timeseries stay in
> memory to recover informations more faster.
> But I got timeseries from last 3 months and I found that my timeseries
> ingested was grew little, like this graph and in the same time, I
> needed to increase the memory ram and CPU of the our instances sometimes.
There was an interesting talk at the recent PromCon EU
> Hi everyone!
> I'm doing a study about how much time we have in our prometheus instances.
> First of all, I thought that prometheus memory grew because number
> timeseries ingested. I thought like this because timeseries stay in
> memory to recover informations more faster.
> But I got timeseries from last 3 months and I found that my timeseries
> ingested was grew little, like this graph and in the same time, I
> needed to increase the memory ram and CPU of the our instances sometimes.
(https://promcon.io/2022-munich/talks/why-is-it-so-big-analysing-the-m/)
which is available on YouTube, but basically the main memory usage is
generally due to the number of time series, with only a very minor usage
due to queries.
--
Stuart Clark
Julio Leal
Nov 22, 2022, 8:16:43 PM11/22/22
to Prometheus Users
Hi Stuart
Thank you so much! It was very useful! I got a lot of insights!
Reply all
Reply to author
Forward
0 new messages