How to combine counter data which scrapes every 5 min using node_exporter
12 views
Skip to first unread message

Umut Cokbilir
Dec 3, 2022, 4:37:05 AM12/3/22
to Prometheus Users
Hi All,
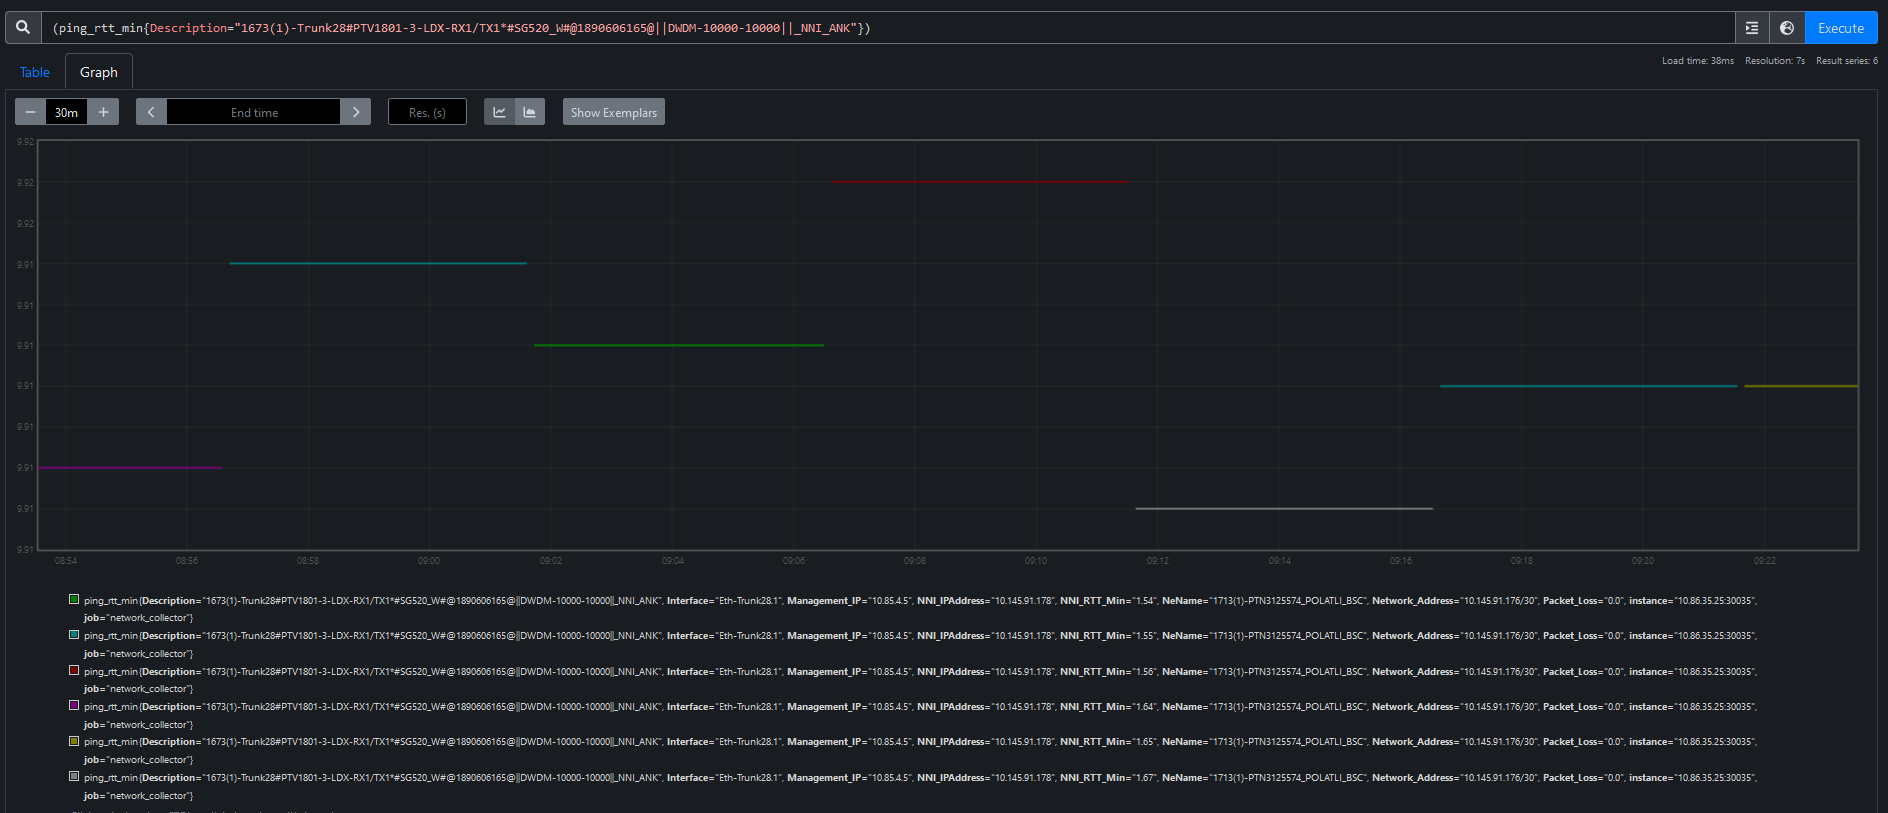
I've tried to use "rate" function to combine but it didn't work as expected. How to combine the data below.
example; it returns empty query result
rate(ping_rtt_min{Description="1673(1)-Trunk28#PTV1801-3-LDX-RX1/TX1*#SG520_W#@1890606165@||DWDM-10000-10000||_NNI_ANK"}[10m])
# HELP ping_rtt_min RTT Min
# TYPE ping_rtt_min counter
ping_rtt_min{Description="1673(1)-Trunk28#PTV1801-3-LDX-RX1/TX1*#SG520_W#@1890606165@||DWDM-10000-10000||_NNI_ANK",Interface="Eth-Trunk28.1",Management_IP="10.85.4.5",NNI_IPAddress="10.145.91.178",NNI_RTT_Min="1.69",NeName="1713(1)-PTN3125574_POLATLI_BSC",Network_Address="10.145.91.176/30",Packet_Loss="0.0"} 9.906
ping_rtt_min{Description="1673(2)-Trunk28#PTV1802-3-LDX-RX1/TX1*#SG520_P#@1890606165A@||DWDM-10000-10000||_NNI_ANK",Interface="Eth-Trunk28.1",Management_IP="10.85.4.6",NNI_IPAddress="10.145.91.182",NNI_RTT_Min="11.02",NeName="1713(2)-PTN3125575_POLATLI_BSC",Network_Address="10.145.91.180/30",Packet_Loss="0.0"} 19.042
ping_rtt_min{Description="1713(1)-Trunk28#PSK8803-31-TQX-RX2/TX2*#SG520_W#@1890606165@||DWDM-10000-10000||_NNI_ANK",Interface="Eth-Trunk28.1",Management_IP="10.85.4.1",NNI_IPAddress="10.145.91.177",NNI_RTT_Min="1.57",NeName="1673(1)-PTN3120590_PURSAKLAR_PLAZA",Network_Address="10.145.91.176/30",Packet_Loss="0.0"} 8.336
ping_rtt_min{Description="1713(2)-Trunk28#PSK8804-30-TTX-RX8/TX8*#SG520_P#@1890606165A@||DWDM-10000-10000||_NNI_ANK",Interface="Eth-Trunk28.1",Management_IP="10.85.4.2",NNI_IPAddress="10.145.91.181",NNI_RTT_Min="11.28",NeName="1673(2)-PTN3120591_PURSAKLAR_PLAZA",Network_Address="10.145.91.180/30",Packet_Loss="0.0"} 7.773
Thanks.

Stuart Clark
Dec 3, 2022, 4:47:36 AM12/3/22
to Umut Cokbilir, Prometheus Users
From that entry it looks like data values are being included within the metric as labels. These need splitting out into their own separate metrics (e.g. NNI_RTT_Min and Packet_Loss). As it stands you are creating new time series for basically every scrape, which results in the lines you are seeing in your graph. Also as it is a cardinality issue it will cause problems with the data storage side of things too.
It is important that labels are never used for data values, and
just contain fixed descriptive entries (such as names, etc.).
If you correct that things should look better.
--
Stuart Clark
Reply all
Reply to author
Forward
0 new messages