Prometheus hangs after compaction
232 views
Skip to first unread message

pwmapo
Mar 30, 2022, 6:14:24 AM3/30/22
to Prometheus Users
Hello everyone!
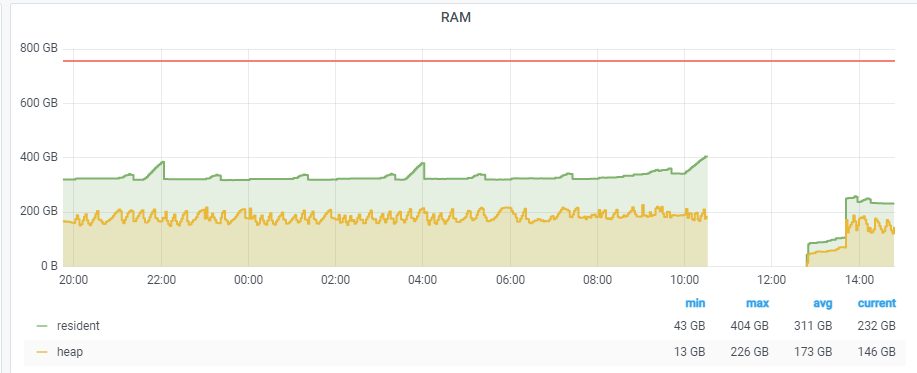
We are running Prometheus on a larger scale - 35 million metrics. We have been at this scale for some time now (~1 year). For the last two months we started to experience problems after a large compaction. This happens from time to time, not periodically, without a time pattern. What happens is that Prometheus stops responding to API requests, /metrics endpoints doesn't work and it stops doing internal processes (further compactions don't happen, alerting rules evaluation throws errors), but seems that it continues to scrape all the targets (network usage on the machine does not drop and the WAL increases). The only way to get it out of this state is to restart the Prometheus docker container.
Image that shows it happens during (or maybe right before it finishes) the large compaction:
Log for alert execution error:
level=warn ts=2022-03-28T10:59:43.076Z caller=manager.go:603 component="rule manager" group=push_requests_submitted.alert msg="Evaluating rule failed" rule="alert: Push_Requests_Submitted expr: "expression" for: 1m " err="query timed out in query queue"

Ben Kochie
Mar 30, 2022, 6:17:48 AM3/30/22
to pwmapo, Prometheus Users
What version of Prometheus?
What versions have you changed recently?
This may be more related to your query patterns. Have you enabled query logging?
--
You received this message because you are subscribed to the Google Groups "Prometheus Users" group.
To unsubscribe from this group and stop receiving emails from it, send an email to prometheus-use...@googlegroups.com.
To view this discussion on the web visit https://groups.google.com/d/msgid/prometheus-users/fe553413-a52d-4d9b-9a6f-c5fe82f95609n%40googlegroups.com.
pwmapo
Mar 31, 2022, 4:27:32 AM3/31/22
to Prometheus Users
Thank you for swift answer!
We are running Prometheus version 2.30.3. Reason for this is that we are having scrape issues on newer versions of Prometheus that we are investigating at the moment (we might open a new conversation about that issue).
We don't have query logs from that time, we don't have them enabled all the time because they generate a lot of data (we have around 300 queries per second). Do you have any suggestions what should we look for in query logs?
We can turn them on for short periods of time.
Reply all
Reply to author
Forward
0 new messages