Prometheus is not showing the metric gathered from netdata
213 views
Skip to first unread message

Yashar Nesabian
May 10, 2020, 12:51:53 PM5/10/20
to Prometheus Users
I have a job on the Prometheus which gathers metrics from 4 netdata master servers. Here is the scenario I had:
172.16.77.50 is our Prometheus server and 172.16.76.168 is our grafana server so I think the last error is not related to my problem
- on netdata master number 1, I gather metrics of about 200 slaves
- For some reason, I decided to move 12 slaves (a1,a2,a3,a4,b1,b2,b3,b4,c1,c2,c3,c4) from the first netdata master to the second netdata master
- Now I only see metrics from 8 servers on the Prometheus server a1,a2,a3,a4,b1,b2,b3,b4) coming from the second master
- I check the job status in the targets page and I see all 4 masters are up and metrics are gathered successfully
- Here is the URL which Prometheus uses to read the metrics from the netdata master number 2: http://172.16.76.152:19999/api/v1/allmetrics?format=prometheus_all_hosts
- I grep the downloaded file with hosts metrics for the c1,c2,c3,c4 hosts and I see netdata is sending all the metrics relevant to these slaves
- But when I search for the metric in the Graph page, I don't see any results:
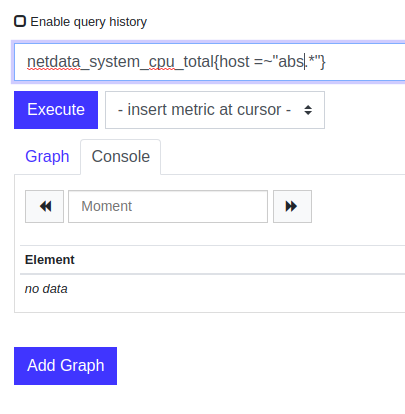
all the servers' time is synced and are correct.
here is the output of systemctl status prometheus:
May 10 19:35:07 devops-mon-01 systemd[1]: Reloading Prometheus.May 10 19:35:07 devops-mon-01 prometheus[6076]: level=info ts=2020-05-10T15:05:07.407Z caller=main.go:734 msg="Loading configuration file" filename=/etc/prometheus/prometheus.ymlMay 10 19:35:07 devops-mon-01 prometheus[6076]: level=info ts=2020-05-10T15:05:07.416Z caller=main.go:762 msg="Completed loading of configuration file" filename=/etc/prometheus/prometheus.ymlMay 10 19:35:07 devops-mon-01 systemd[1]: Reloaded Prometheus.May 10 19:53:22 devops-mon-01 prometheus[6076]: level=error ts=2020-05-10T15:23:22.621Z caller=api.go:1347 component=web msg="error writing response"bytesWritten=0 err="write tcp 172.16.77.50:9090->172.16.76.168:56778: write: broken pipe"May 10 20:25:53 devops-mon-01 prometheus[6076]: level=error ts=2020-05-10T15:55:53.058Z caller=api.go:1347 component=web msg="error writing response"bytesWritten=0 err="write tcp 172.16.77.50:9090->172.16.76.168:41728: write: broken pipe"172.16.77.50 is our Prometheus server and 172.16.76.168 is our grafana server so I think the last error is not related to my problem

Julius Volz
May 10, 2020, 3:49:23 PM5/10/20
to Yashar Nesabian, Prometheus Users
[+CCing back prometheus-users, which I had accidentally removed]
How similar are the others? The ones in your example are from this afternoon (2:57pm UTC), I guess that's when you downloaded the file for grepping first?
A regular instant vector selector in PromQL (like just "foo") will only select data points up to 5 minutes into the past from the current evaluation timestamp. So the table view would not show samples for any series whose last sample is more than 5m into the past. You could try a range selector like "foo[24h]" on these to see if any historical data is returned (I would expect so).
On Sun, May 10, 2020 at 9:37 PM Yashar Nesabian <nesa...@gmail.com> wrote:
Sure, here it is:
if the second parameter is the timestamp, then yes that's the problem, but I wonder how come other metrics are stored by the Prometheus server? because they also have a similar timestampgrep -i "netdata_web_log_detailed_response_codes_total" allmetrics\?format=prometheus_all_hosts\&source=as-collected.2 | grep -i "abs" netdata_web_log_detailed_response_codes_total{chart="web_log_passenger_event.detailed_response_codes",family="responses",dimension="200",instance="abs-02.x.y.zabs"} 245453 1589122673736 netdata_web_log_detailed_response_codes_total{chart="web_log_passenger_event.detailed_response_codes",family="responses",dimension="400",instance="abs-02.x.y.zabs"} 82 1589122673736 netdata_web_log_detailed_response_codes_total{chart="web_log_passenger_event.detailed_response_codes",family="responses",dimension="401",instance="abs-02.x.y.zabs"} 6 1589122673736 netdata_web_log_detailed_response_codes_total{chart="web_log_passenger_event.detailed_response_codes",family="responses",dimension="200",instance="abs-04.x.y.zabs"} 238105 1589122673017 netdata_web_log_detailed_response_codes_total{chart="web_log_passenger_event.detailed_response_codes",family="responses",dimension="400",instance="abs-04.x.y.zabs"} 59 1589122673017 netdata_web_log_detailed_response_codes_total{chart="web_log_passenger_event.detailed_response_codes",family="responses",dimension="401",instance="abs-04.x.y.zabs"} 3 1589122673017 netdata_web_log_detailed_response_codes_total{chart="web_log_passenger_event.detailed_response_codes",family="responses",dimension="200",instance="abs-03.x.y.zabs"} 241708 1589122673090 netdata_web_log_detailed_response_codes_total{chart="web_log_passenger_event.detailed_response_codes",family="responses",dimension="400",instance="abs-03.x.y.zabs"} 68 1589122673090 netdata_web_log_detailed_response_codes_total{chart="web_log_passenger_event.detailed_response_codes",family="responses",dimension="401",instance="abs-03.x.y.zabs"} 5 1589122673090 netdata_web_log_detailed_response_codes_total{chart="web_log_passenger_event.detailed_response_codes",family="responses",dimension="200",instance="abs-01.x.y.zabs"} 250296 1589122674872 netdata_web_log_detailed_response_codes_total{chart="web_log_passenger_event.detailed_response_codes",family="responses",dimension="400",instance="abs-01.x.y.zabs"} 81 1589122674872 netdata_web_log_detailed_response_codes_total{chart="web_log_passenger_event.detailed_response_codes",family="responses",dimension="401",instance="abs-01.x.y.zabs"} 7 1589122674872On Sun, May 10, 2020 at 10:36 PM Julius Volz <juliu...@promlabs.com> wrote:Hmm, odd. Could you share some of the lines that your grep finds in the metrics output of the correctly scraped target?The example at the top of https://github.com/netdata/netdata/issues/3891 suggests that Netdata sets client-side timestamps for samples (which is uncommon for Prometheus otherwise). Maybe those timestamps are too far in the past (more than 5 minutes), so they would not be shown anymore?
--
You received this message because you are subscribed to the Google Groups "Prometheus Users" group.
To unsubscribe from this group and stop receiving emails from it, send an email to prometheus-use...@googlegroups.com.
To view this discussion on the web visit https://groups.google.com/d/msgid/prometheus-users/156d8c36-c1de-4ca3-8b2a-2cfbcb5895fc%40googlegroups.com.
--Julius VolzPromLabs - promlabs.com--Best Regards
Yashar Nesabian
Senior Site Reliability Engineer
Julius Volz
PromLabs - promlabs.com
Yashar Nesabian
May 10, 2020, 4:13:21 PM5/10/20
to Prometheus Users
The other slaves have 2-3 seconds difference with the timestamp of these metrics, and yes the 2:57pm UTC is almost correct (I don't know the exact time) and using foo[24h] is not very informative right now because we still have the previous metrics when the slaves were on netdata master number 1.
I did another experiment, I downloaded the metric files again and ran the command (date +%s) on the Prometheus server almost at the same time,
The metrics' timestamp was 1589141392868 and the server's timestamp was 1589141393 So I think this is not the problem
To unsubscribe from this group and stop receiving emails from it, send an email to promethe...@googlegroups.com.
To view this discussion on the web visit https://groups.google.com/d/msgid/prometheus-users/156d8c36-c1de-4ca3-8b2a-2cfbcb5895fc%40googlegroups.com.
--Julius VolzPromLabs - promlabs.com
--Best Regards
Yashar Nesabian
Senior Site Reliability Engineer
Yashar Nesabian
May 10, 2020, 4:34:17 PM5/10/20
to Prometheus Users
here is the chart for the last 6 hours for the metric: (the last metric is for 14:43 )

Julius Volz
May 10, 2020, 4:37:31 PM5/10/20
to Yashar Nesabian, Prometheus Users
Huh! Ok, strange. And I guess you double-checked that that is what the Prometheus server really scrapes... then I'm a bit out of suggestions at the moment without poking at the setup myself.
To unsubscribe from this group and stop receiving emails from it, send an email to prometheus-use...@googlegroups.com.
To view this discussion on the web visit https://groups.google.com/d/msgid/prometheus-users/75c2fc70-af2a-4d23-beb8-0682bb250437%40googlegroups.com.
Yashar Nesabian
May 10, 2020, 4:50:06 PM5/10/20
to Prometheus Users
Yes I wget the same address as Prometheus scrapes
To view this discussion on the web visit https://groups.google.com/d/msgid/prometheus-users/75c2fc70-af2a-4d23-beb8-0682bb250437%40googlegroups.com.

Julien Pivotto
May 10, 2020, 4:54:29 PM5/10/20
to Yashar Nesabian, Prometheus Users
Hi,
Could you try with honor_timestamps: false ?
Thanks
> >>>> an email to promethe...@googlegroups.com <javascript:>.
> >>>> .
> >>
> >> *Yashar Nesabian*
> >>
> >> *Senior Site Reliability Engineer*
> To view this discussion on the web visit https://groups.google.com/d/msgid/prometheus-users/763aa44f-814a-40c9-b291-da1251329134%40googlegroups.com.
--
Julien Pivotto
@roidelapluie
Could you try with honor_timestamps: false ?
Thanks
> >>>> To view this discussion on the web visit
> >>>> https://groups.google.com/d/msgid/prometheus-users/156d8c36-c1de-4ca3-8b2a-2cfbcb5895fc%40googlegroups.com
> >>>> <https://groups.google.com/d/msgid/prometheus-users/156d8c36-c1de-4ca3-8b2a-2cfbcb5895fc%40googlegroups.com?utm_medium=email&utm_source=footer>
> >>>> https://groups.google.com/d/msgid/prometheus-users/156d8c36-c1de-4ca3-8b2a-2cfbcb5895fc%40googlegroups.com
> >>>> .
> >>>>
> >>>
> >>>
> >>> --
> >>> Julius Volz
> >>> PromLabs - promlabs.com
> >>>
> >>
> >>
> >> --
> >>
> >> *Best Regards*
> >>>
> >>>
> >>> --
> >>> Julius Volz
> >>> PromLabs - promlabs.com
> >>>
> >>
> >>
> >> --
> >>
> >>
> >> *Yashar Nesabian*
> >>
> >> *Senior Site Reliability Engineer*
> You received this message because you are subscribed to the Google Groups "Prometheus Users" group.
> To unsubscribe from this group and stop receiving emails from it, send an email to prometheus-use...@googlegroups.com.
> To view this discussion on the web visit https://groups.google.com/d/msgid/prometheus-users/763aa44f-814a-40c9-b291-da1251329134%40googlegroups.com.
--
Julien Pivotto
@roidelapluie
Yashar Nesabian
May 10, 2020, 5:29:54 PM5/10/20
to Prometheus Users
I installed Prometheus server on a test machine with the same ansible as what we used to install our main Prometheus and added the netdata job and metrics are fine on the local Prometheus, now I'm sure this is a Prometheus problem
To view this discussion on the web visit https://groups.google.com/d/msgid/prometheus-users/75c2fc70-af2a-4d23-beb8-0682bb250437%40googlegroups.com.
Julius Volz
May 10, 2020, 5:36:46 PM5/10/20
to Yashar Nesabian, Prometheus Users
I wonder if maybe at one point Netdata returned timestamps that are in the future for those time series, and now your production Prometheus cannot scrape the earlier timestamps for the same series anymore. Try setting -log.level=debug in production and see if there are any out-of-order scrape error messages of the kind:
level=debug ts=2020-05-10T21:35:17.206Z caller=scrape.go:1245 component="scrape manager" scrape_pool=<scrape pool name> target=<target> msg="Out of order sample" series=<series>
To unsubscribe from this group and stop receiving emails from it, send an email to prometheus-use...@googlegroups.com.
To view this discussion on the web visit https://groups.google.com/d/msgid/prometheus-users/515088f5-d330-4c16-92fd-e173f523017c%40googlegroups.com.
Yashar Nesabian
May 11, 2020, 12:21:43 PM5/11/20
to Prometheus Users
Changing the netdata master node fixed the problem, but I don't have any logical explanation for it.
To view this discussion on the web visit https://groups.google.com/d/msgid/prometheus-users/515088f5-d330-4c16-92fd-e173f523017c%40googlegroups.com.
Reply all
Reply to author
Forward
0 new messages