How to differentiate similar metrics in grafana by different datasources?
133 views
Skip to first unread message
Mohammad Khoschnasar
Nov 26, 2021, 9:08:28 AM11/26/21
to Prometheus Users
Hi all,
I'm a newbie in prometheus. So go easy on me please.
So I have two apps with similar metrics, which I want to scrape metrics to prometheus. My prometheus is installed on OS (no k8s). I have defined jobs for these two apps in my prometheus.yml and then defined another datasource in grafana.
The problem is that metrics are being mixed, because they're coming to one prometheus datasource(I have no idea how to route the metrics for second app to the second datasource).
I also tried to separate them into different dashboards with the help of adding query (instance) to the PromQL section in grafana, but no luck. I don't know if this is the right thing to do.
So please someone explain to me, how this situations in real world works.
Thanks in advance.
M
Stuart Clark
Nov 26, 2021, 9:27:17 AM11/26/21
to Mohammad Khoschnasar, Prometheus Users
instance, so in your case you'd only have a single one as you only have
one Prometheus server.
You can then use PromQL to query your metrics. Each job automatically
gets both instance & job labels added, so you'd be able to differentiate
between your two apps.
--
Stuart Clark
Mohammad Khoschnasar
Nov 26, 2021, 9:56:35 AM11/26/21
to Prometheus Users
Sorry @stuartclark
I have sent mistakenly a private message to you.
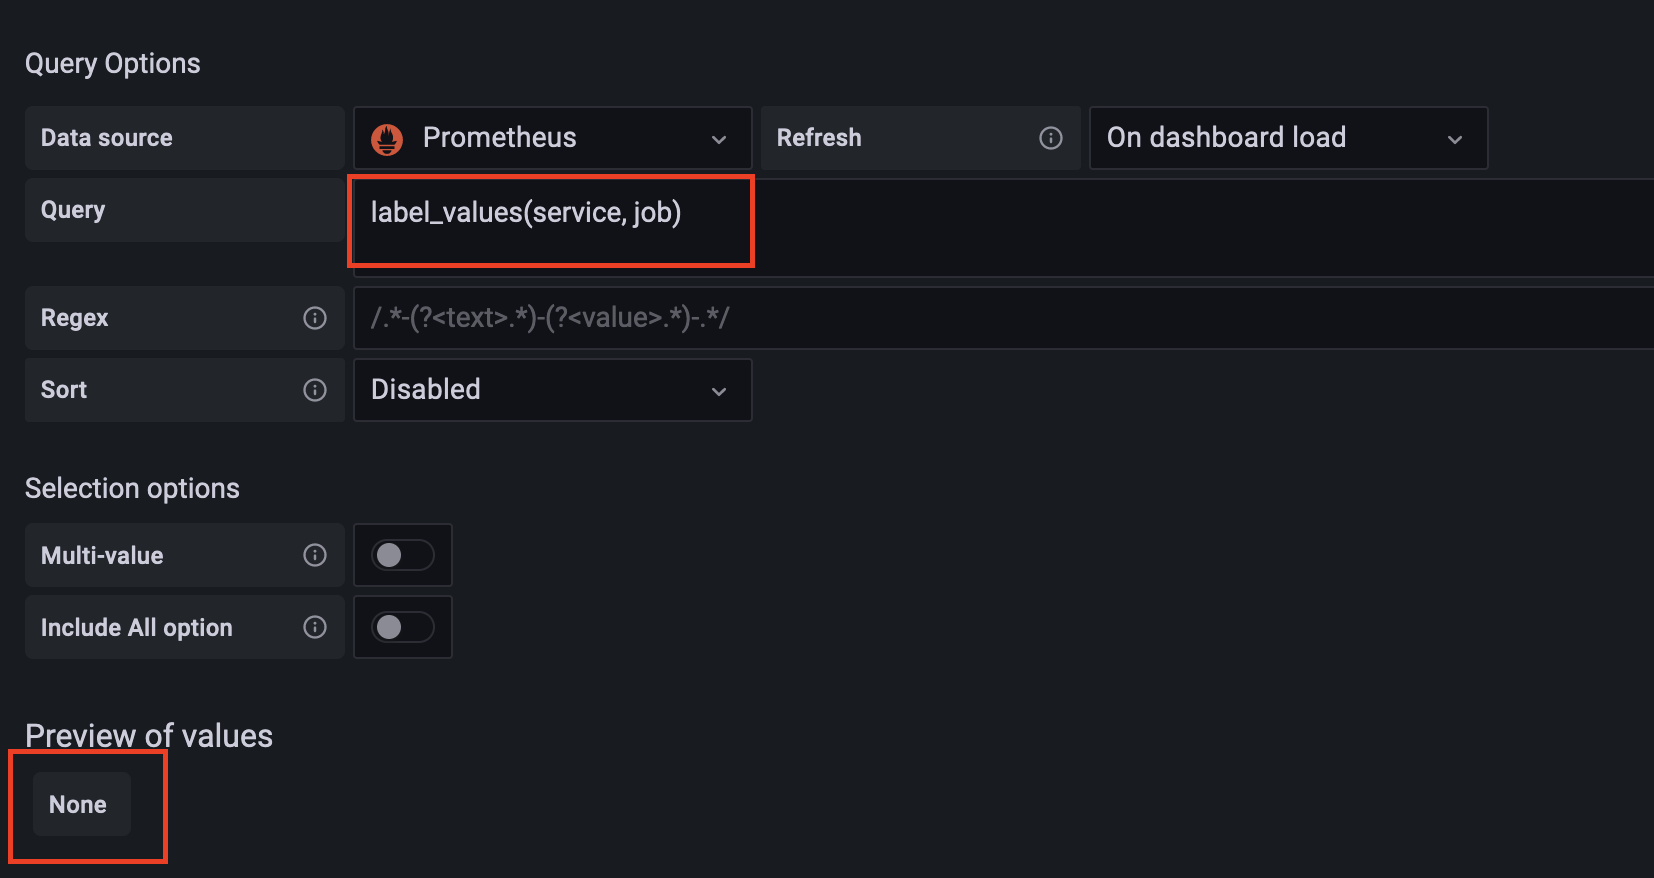
In case other users can also follow, I have two Traefik instances and respectively I have defined two jobs for them in my prometheus.yml .
So I'm able to reach the jobs in the dashboard's setting by: label_value(job)
But a combination like label_values(service, job) doesn't work and I'm still getting all services. Please check the pic:

I'm sort of looking for an AND between the job_name and the services related to the specific job.
Stuart Clark
Nov 26, 2021, 10:46:17 AM11/26/21
to Mohammad Khoschnasar, Prometheus Users
So if you have two instances of the same application you'd normally only have a single job with two instances listed.
What are you trying to do in Grafana? That looks a bit like the variables page rather than a panel in the dashboard.
What are you trying to do in Grafana? That looks a bit like the variables page rather than a panel in the dashboard.
--
Sent from my Android device with K-9 Mail. Please excuse my brevity.
Sent from my Android device with K-9 Mail. Please excuse my brevity.
Mohammad Khoschnasar
Nov 26, 2021, 10:56:24 AM11/26/21
to Prometheus Users
The picture is the variable page in Grafana dashboard's setting.
So I thought instead of changing the queries in each panel of the dashboard, I'll change the variable for the whole dashboard.
Let me explain again.
I have two Traefik instances. The metrics of those two are going to one prometheus instance. In prometheus.yml, I have defined two jobs under the scrape_config and now in grafana I want to separate the services that coming from Traefik-A from the services coming from Traefik-B. What is the best way to do that?Going in each panel and change the query is not efficient I think. That's why I decided to change the main varibale in dashboard setting.
Brian Candler
Nov 26, 2021, 11:05:46 AM11/26/21
to Prometheus Users
This isn't really a grafana mailing list - there's a separate grafana discussion forum.
If you're trying to make a grafana variable which appears as a drop-down menu, then it only makes sense to do show the values of a single label. But you can make one variable, and a second one which depends on the first, if you need two drop-down menus.
Stuart Clark
Nov 26, 2021, 11:16:22 AM11/26/21
to Mohammad Khoschnasar, Prometheus Users
On 26/11/2021 15:56, Mohammad
Khoschnasar wrote:
The picture is the variable page in Grafana dashboard's setting.
So I thought instead of changing the queries in each panel of the dashboard, I'll change the variable for the whole dashboard.
Let me explain again.I have two Traefik instances. The metrics of those two are going to one prometheus instance. In prometheus.yml, I have defined two jobs under the scrape_config and now in grafana I want to separate the services that coming from Traefik-A from the services coming from Traefik-B. What is the best way to do that?Going in each panel and change the query is not efficient I think. That's why I decided to change the main varibale in dashboard setting.
So there are a few things I'd suggest doing:
1. Change your prometheus.yaml to only have one job, but listing both Traefik instances
2. Add a Grafana variable with "label_values(metric,
label)", where metric is the name of one of the Traefik metrics
and label = instance
3. Make sure each of the queries within your dashboard have
        job='<job>',instance=$<variable> (where job is the
        name of the job in prometheus.yaml & variable is whatever
        you called the Grafana variable).
--
Stuart Clark
Reply all
Reply to author
Forward
0 new messages
