histogram_quantile problem
360 views
Skip to first unread message

zjws...@gmail.com
Apr 12, 2018, 3:23:30 AM4/12/18
to Prometheus Users
prometheus 2.2.1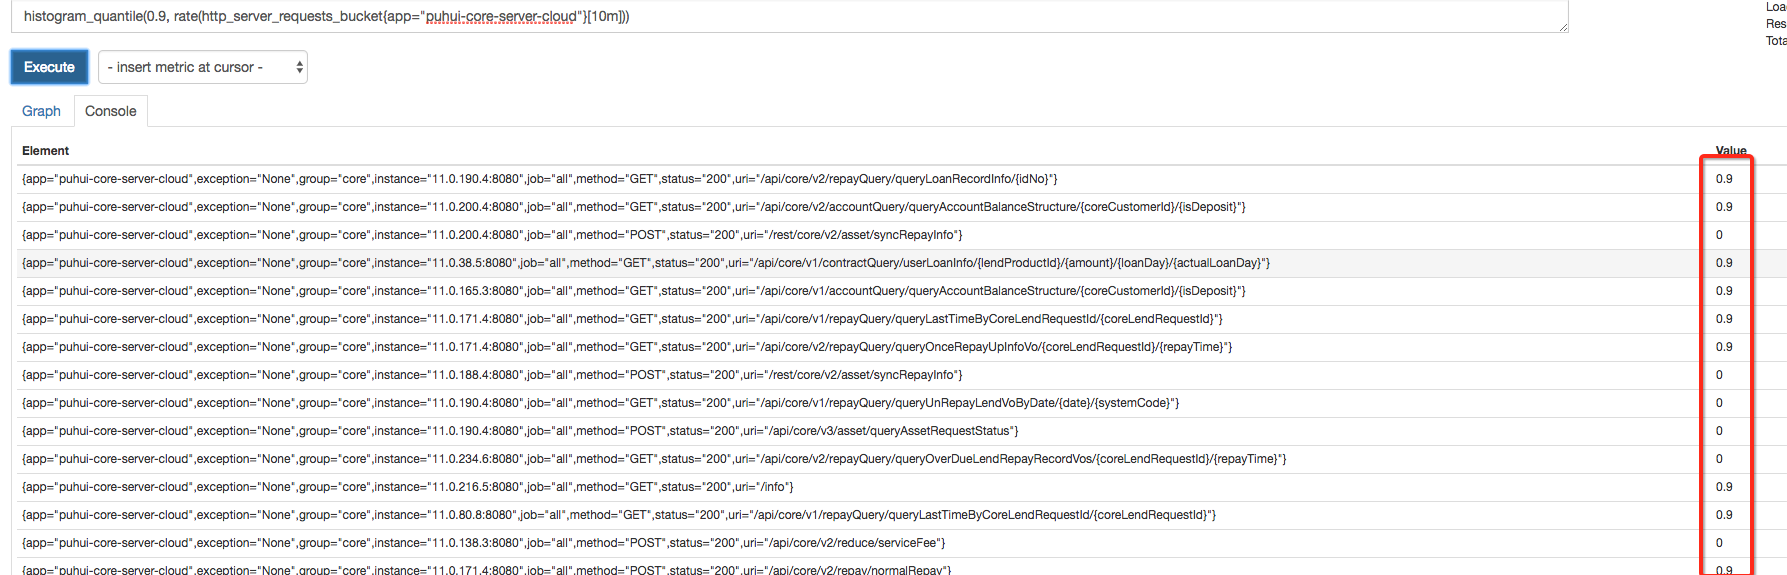
why the result is decided by φ? obvious wrong result! am i not using it correctly?

Brian Brazil
Apr 12, 2018, 3:29:32 AM4/12/18
to zjws...@gmail.com, Prometheus Users
I'm guessing you only have 1-2 data points for this period. For a 90th percentile to make sense you need at least 10.
Brian Brazil
Saren SR
Apr 12, 2018, 11:49:48 PM4/12/18
to Prometheus Users
i don't think so,the app'tps is about 1000/s,10minuates can not be 1-2 points
在 2018年4月12日星期四 UTC+8下午3:29:32,Brian Brazil写道:
在 2018年4月12日星期四 UTC+8下午3:29:32,Brian Brazil写道:
Brian Brazil
Apr 13, 2018, 2:52:09 AM4/13/18
to Saren SR, Prometheus Users
On 13 April 2018 at 04:49, Saren SR <zjws...@gmail.com> wrote:
i don't think so,the app'tps is about 1000/s,10minuates can not be 1-2 points
The application as a whole might be, but that's not the same as each endpoint on each instance individually getting 1000/s.
Brian
在 2018年4月12日星期四 UTC+8下午3:29:32,Brian Brazil写道:On 12 April 2018 at 08:23, <zjws...@gmail.com> wrote:prometheus 2.2.1
why the result is decided by φ? obvious wrong result! am i not using it correctly?I'm guessing you only have 1-2 data points for this period. For a 90th percentile to make sense you need at least 10.--Brian Brazil
--
You received this message because you are subscribed to the Google Groups "Prometheus Users" group.
To unsubscribe from this group and stop receiving emails from it, send an email to prometheus-users+unsubscribe@googlegroups.com.
To post to this group, send email to prometheus-users@googlegroups.com.
To view this discussion on the web visit https://groups.google.com/d/msgid/prometheus-users/7d801302-4d75-4303-a782-4ad0c4376a94%40googlegroups.com.
Brian Brazil
Saren SR
Apr 16, 2018, 5:09:57 AM4/16/18
to Prometheus Users
but i can be sure most endpoints are more than 1-2data points in 10 minuates' period
在 2018年4月13日星期五 UTC+8下午2:52:09,Brian Brazil写道:
在 2018年4月13日星期五 UTC+8下午2:52:09,Brian Brazil写道:
On 13 April 2018 at 04:49, Saren SR <zjws...@gmail.com> wrote:i don't think so,the app'tps is about 1000/s,10minuates can not be 1-2 pointsThe application as a whole might be, but that's not the same as each endpoint on each instance individually getting 1000/s.Brian
--
在 2018年4月12日星期四 UTC+8下午3:29:32,Brian Brazil写道:On 12 April 2018 at 08:23, <zjws...@gmail.com> wrote:prometheus 2.2.1
why the result is decided by φ? obvious wrong result! am i not using it correctly?I'm guessing you only have 1-2 data points for this period. For a 90th percentile to make sense you need at least 10.--Brian Brazil
You received this message because you are subscribed to the Google Groups "Prometheus Users" group.
To unsubscribe from this group and stop receiving emails from it, send an email to prometheus-use...@googlegroups.com.
To post to this group, send email to promethe...@googlegroups.com.
To view this discussion on the web visit https://groups.google.com/d/msgid/prometheus-users/7d801302-4d75-4303-a782-4ad0c4376a94%40googlegroups.com.

Julius Volz
Apr 16, 2018, 6:51:48 AM4/16/18
to Saren SR, Prometheus Users
You could share what the underlying bucket rates are before applying the histogram_quantile() function:
rate(http_server_requests_bucket{app="puhui-core-server-cloud"}[10m])
To unsubscribe from this group and stop receiving emails from it, send an email to prometheus-users+unsubscribe@googlegroups.com.
To post to this group, send email to prometheus-users@googlegroups.com.
To view this discussion on the web visit https://groups.google.com/d/msgid/prometheus-users/77a134f8-10c6-4d6e-aca1-c83b1ed33682%40googlegroups.com.
Saren SR
Apr 19, 2018, 11:01:20 PM4/19/18
to Prometheus Users
CumulativeHistogram.buckets(CumulativeHistogram.linear(0.0, 1.0, 5))
http_server_requests_bucket{method="GET",uri="/",exception="None",status="302",app="monitor-app",le="0.0",} 0.0
http_server_requests_bucket{method="GET",uri="/",exception="None",status="302",app="monitor-app",le="1.0",} 55.0
http_server_requests_bucket{method="GET",uri="/",exception="None",status="302",app="monitor-app",le="2.0",} 55.0
http_server_requests_bucket{method="GET",uri="/",exception="None",status="302",app="monitor-app",le="3.0",} 55.0
http_server_requests_bucket{method="GET",uri="/",exception="None",status="302",app="monitor-app",le="4.0",} 55.0
http_server_requests_bucket{method="GET",uri="/",exception="None",status="302",app="monitor-app",le="+Inf",} 55.0在 2018年4月16日星期一 UTC+8下午6:51:48,Julius Volz写道:
Saren SR
Apr 19, 2018, 11:01:42 PM4/19/18
to Prometheus Users
CumulativeHistogram.buckets(CumulativeHistogram.linear(0.0, 1.0, 5))
http_server_requests_bucket{method="GET",uri="/",exception="None",status="302",app="monitor-app",le="0.0",} 0.0
http_server_requests_bucket{method="GET",uri="/",exception="None",status="302",app="monitor-app",le="1.0",} 55.0
http_server_requests_bucket{method="GET",uri="/",exception="None",status="302",app="monitor-app",le="2.0",} 55.0
http_server_requests_bucket{method="GET",uri="/",exception="None",status="302",app="monitor-app",le="3.0",} 55.0
http_server_requests_bucket{method="GET",uri="/",exception="None",status="302",app="monitor-app",le="4.0",} 55.0
http_server_requests_bucket{method="GET",uri="/",exception="None",status="302",app="monitor-app",le="+Inf",} 55.0在 2018年4月16日星期一 UTC+8下午6:51:48,Julius Volz写道:
You could share what the underlying bucket rates are before applying the histogram_quantile() function:
Julius Volz
Apr 20, 2018, 1:43:20 AM4/20/18
to Saren SR, Prometheus Users
The bucket sizes on that histogram aren't very useful:
- le="0.0" for the first bucket probably doesn't make sense, unless you really have events that take zero time
- the first "real" bucket with le="1.0" already contains 100% (55) of your total events, while the previous bucket contains 0. That means that the histogram_quantile(0.9, ...) calculation will only look at that one bucket and do a linear interpolation of the quantile value within it to find the most likely (on average) quantile value: 0.9 * 1.0 = 0.9. At least that's how I think it works.
What you really want is to define buckets in such a way that they capture your latency profile in more detail. For example, if le="1.0" already matches 100% of your events, then you will want to have more buckets with lower boundaries, and also generally less wide bucket boundaries, so that each bucket only receives some events more than the previous one. That will allow you to calculate more meaningful quantiles from the buckets.
To unsubscribe from this group and stop receiving emails from it, send an email to prometheus-users+unsubscribe@googlegroups.com.
To post to this group, send email to prometheus-users@googlegroups.com.
To view this discussion on the web visit https://groups.google.com/d/msgid/prometheus-users/14f580ba-e353-431e-9f5c-b3a311ad069c%40googlegroups.com.
Saren SR
Apr 20, 2018, 2:23:46 AM4/20/18
to Prometheus Users
thanks very much,since prometheus does not mention it officially in their docs,i don't know there exists some tricks .
在 2018年4月20日星期五 UTC+8下午1:43:20,Julius Volz写道:
在 2018年4月20日星期五 UTC+8下午1:43:20,Julius Volz写道:
Julius Volz
Apr 21, 2018, 5:44:18 AM4/21/18
to Saren SR, Prometheus Users
Have a look at https://prometheus.io/docs/practices/histograms/, especially the section around errors of quantile estimation.
Choosing the right histogram buckets is often a tricky business and requires you to have a rough idea of your service's latency profile.
To unsubscribe from this group and stop receiving emails from it, send an email to prometheus-users+unsubscribe@googlegroups.com.
To post to this group, send email to prometheus-users@googlegroups.com.
To view this discussion on the web visit https://groups.google.com/d/msgid/prometheus-users/c3211253-ce01-45f9-9b68-54e1583fc4fb%40googlegroups.com.
Reply all
Reply to author
Forward
0 new messages