NOT All the Sharded Prometheus scrape targets successfully

Jiaxu LIU
Hello Prom experts,
I am trying to use Prometheus sharding feature.
But I cannot query metrics in all of the leaf Proms. Is this a bug or configuration issue?
Could you please help explain? Thanks a lot in advance!
Prom image is prom/prometheus:v2.13.1
The diagram is as below:
4 containers are running in a single host, with 3 leaf Proms listening on 9090, 9091, 9092 respectively, and one federated prom listening on 19090.
I meant the data of node exporter(localhost:9100/metrics) are split into three shards, which are scraped by Prom1, Prom2, Prom3, and then all the metrics are federated in FederatedProm container. This is a very typical use case for Prom sharding.
Prom1(localhost:9090) ----->
Prom2(localhost:9091)----- > FederatedProm(localhost:19090)
Prom3(localhost:9092) ----->
And a node exporter is listening on localhost:9100 as metric data source.
Each leaf Prom's configurations are as below:
Prom1:
global:
  scrape_interval: 1m
  scrape_timeout: 10s
  evaluation_interval: 10s
  external_labels:
    slave: 0
scrape_configs:
  - job_name: 'local_prometheus'
    static_configs:
    - targets: ['localhost:9090']

  - job_name: 'node_exporter'
    # metrics_path defaults to '/metrics'
    # scheme defaults to 'http'.
    static_configs:
    - targets: ['localhost:9100']
    relabel_configs:
    - source_labels: [__address__]
      modulus:       3    # 3 slaves
      target_label:  __tmp_hash
      action:        hashmod
    - source_labels: [__tmp_hash]
      regex:         ^0$  # This is the 1st  slave
      action:        keep
Prom2:
global:
  scrape_interval: 1m
  scrape_timeout: 10s
  evaluation_interval: 10s
  external_labels:
    slave: 1
scrape_configs:
  - job_name: 'local_prometheus'
    static_configs:
    - targets: ['localhost:9090']

  - job_name: 'node_exporter'
    # metrics_path defaults to '/metrics'
    # scheme defaults to 'http'.
    static_configs:
    - targets: ['localhost:9100']
    relabel_configs:
    - source_labels: [__address__]
      modulus:       3    # 3 slaves
      target_label:  __tmp_hash
      action:        hashmod
    - source_labels: [__tmp_hash]
      regex:         ^1$  # This is the 2nd slave
      action:        keep
Prom3 config:
global:
  scrape_interval: 1m
  scrape_timeout: 10s
  evaluation_interval: 10s
  external_labels:
    slave: 2
scrape_configs:
  - job_name: 'local_prometheus'
    static_configs:
    - targets: ['localhost:9090']

  - job_name: 'node_exporter'
    # metrics_path defaults to '/metrics'
    # scheme defaults to 'http'.
    static_configs:
    - targets: ['localhost:9100']
    relabel_configs:
    - source_labels: [__address__]
      modulus:       3    # 3 slaves
      target_label:  __tmp_hash
      action:        hashmod
    - source_labels: [__tmp_hash]
      regex:         ^2$  # This is the third slave
      action:        keep
=================================
Prom1's console: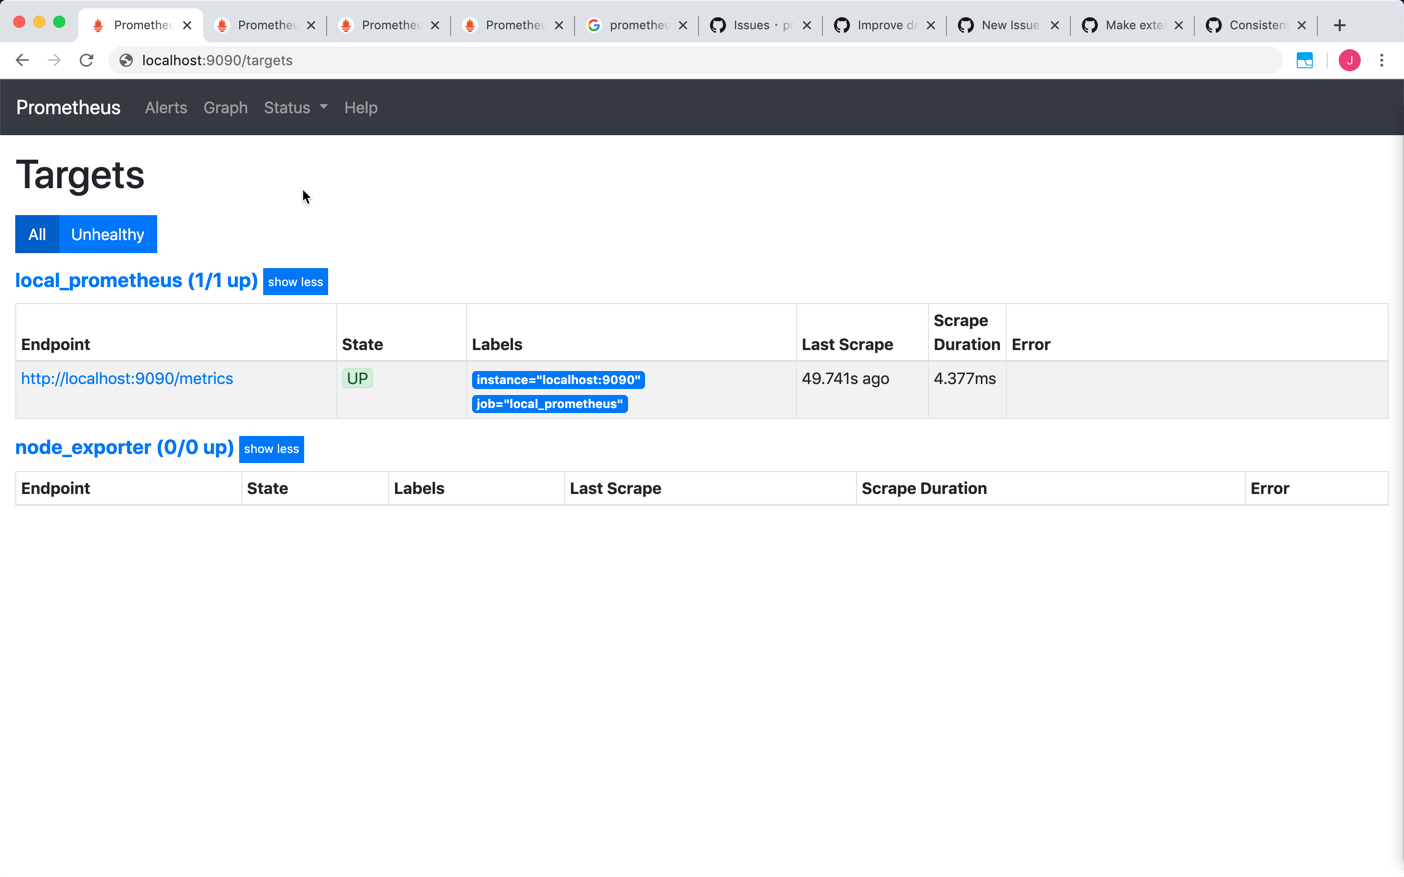
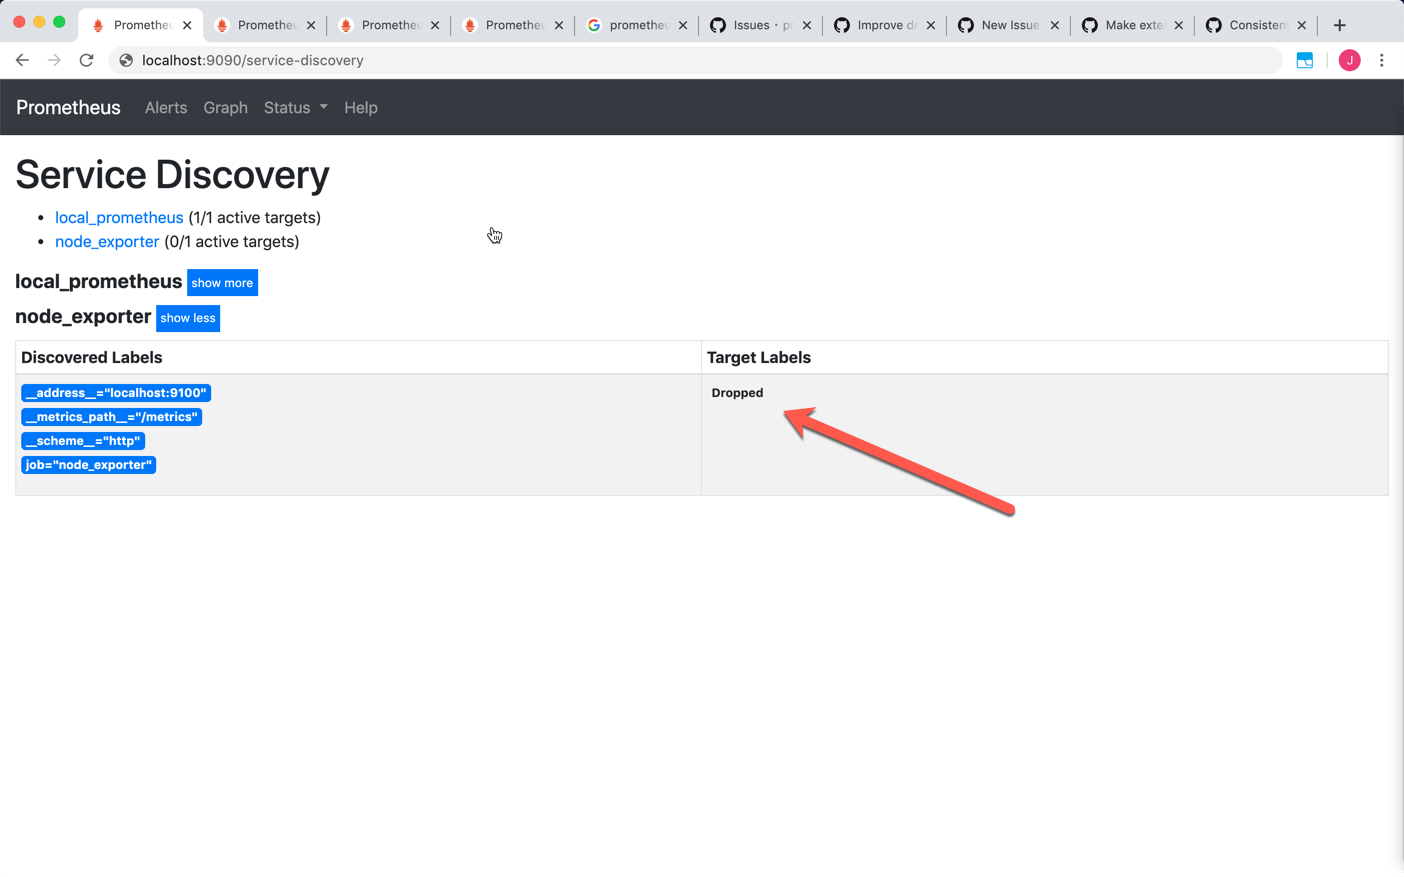
See the "Dropped", it is very confusing...
Prom2's console: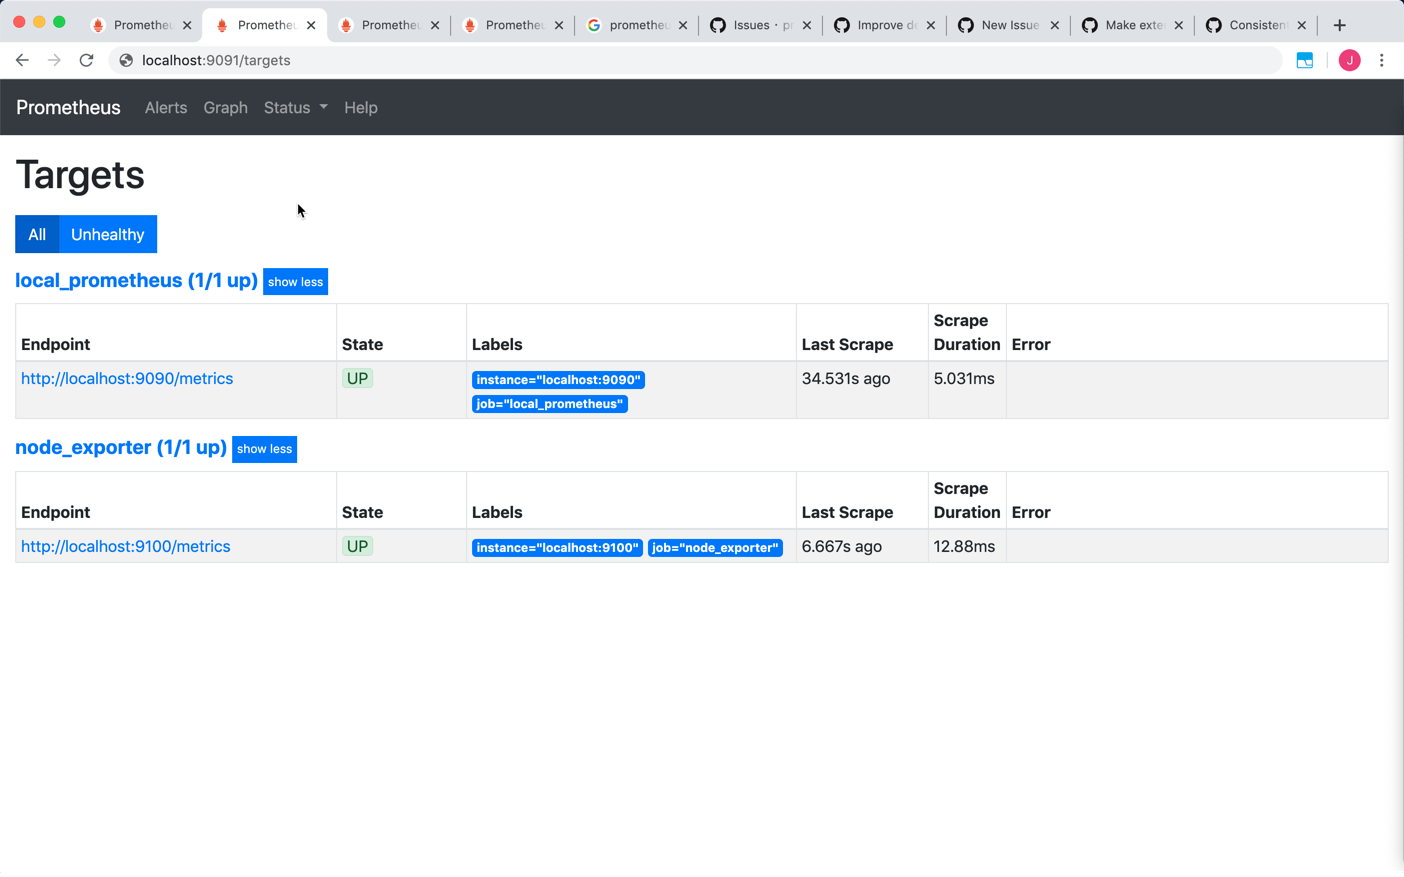
Prom3's console: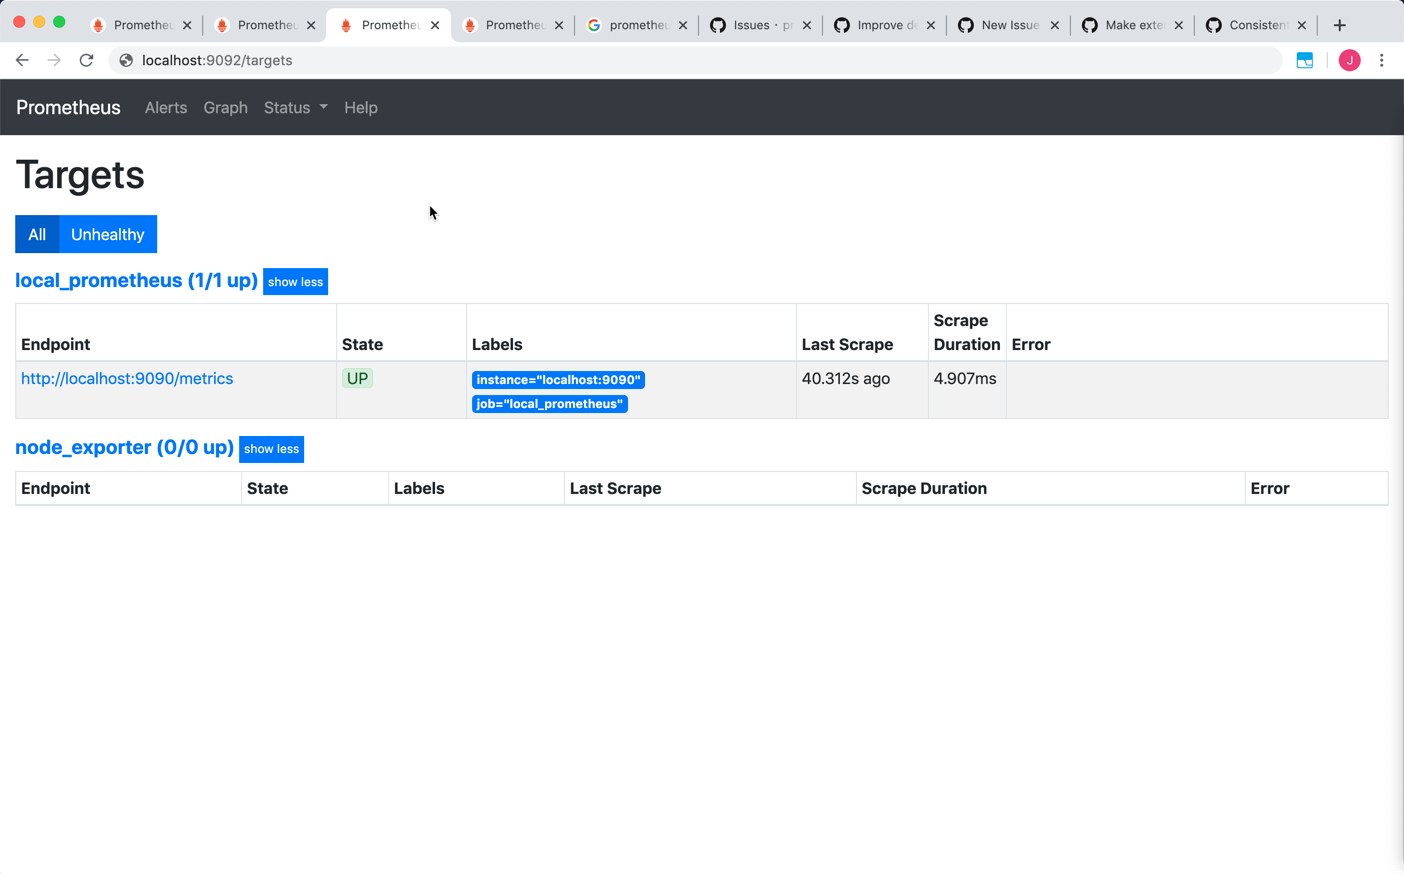
So my question is: why can I find ONLY active target for node-exporter job data in console of Prom2, but find there is no active target for node-exporter job in console of Prom1 and Prom3?
My federated Prom's config is as below:
global:
scrape_interval: 1m
scrape_timeout: 10s
evaluation_interval: 10s
scrape_configs:
- job_name: 'federated_node_exporter'
# metrics_path defaults to '/metrics'
metrics_path: /federate
# scheme defaults to 'http'.
honor_labels: true
honor_timestamps: true
params:
match[]:
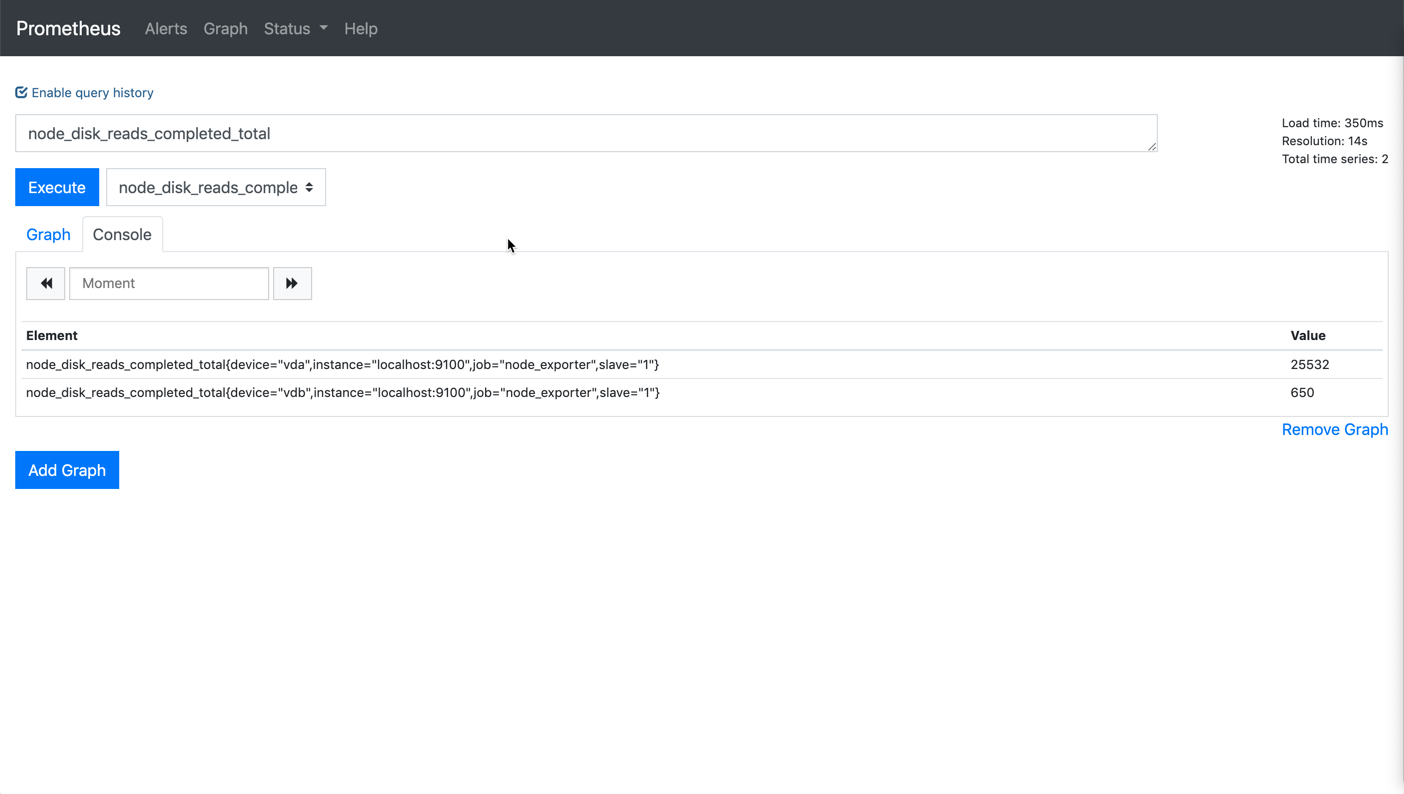
- node_disk_reads_completed_total
- node_cpu_seconds_total
static_configs:
- targets:
- 'localhost:9090'
- 'localhost:9091'
- 'localhost:9092'
And why do I see metrics from ONLY Prom2, but NO metrics from Prom1 and Prom3?
Thanks a lot in advance!
Nice Regards
Casper Liu

Brian Candler
  - job_name: 'node_exporter'
    # metrics_path defaults to '/metrics'
    # scheme defaults to 'http'.
    static_configs:
    - targets: ['localhost:9100']