up query

BHARATH KUMAR

Brian Candler
BHARATH KUMAR
Brian Candler
BHARATH KUMAR

Stuart Clark
> hello,
>
> max_over_time(up[2d]) == 0 is giving me the info like ...for the last
> two days if the server goes down for 1 minute also it was displaying
> in the graph which I don't want. I want the information that for the
> last "X" days it should be completely in an unreachable state.
>
days?
Try sum() instead of max_over_time().
--
Stuart Clark
Brian Candler
Brian Candler
BHARATH KUMAR
yeah. I want only that the servers are down for the whole two days. Its value should always be zero(0) throughout the last 'X' days.
Brian Candler
BHARATH KUMAR
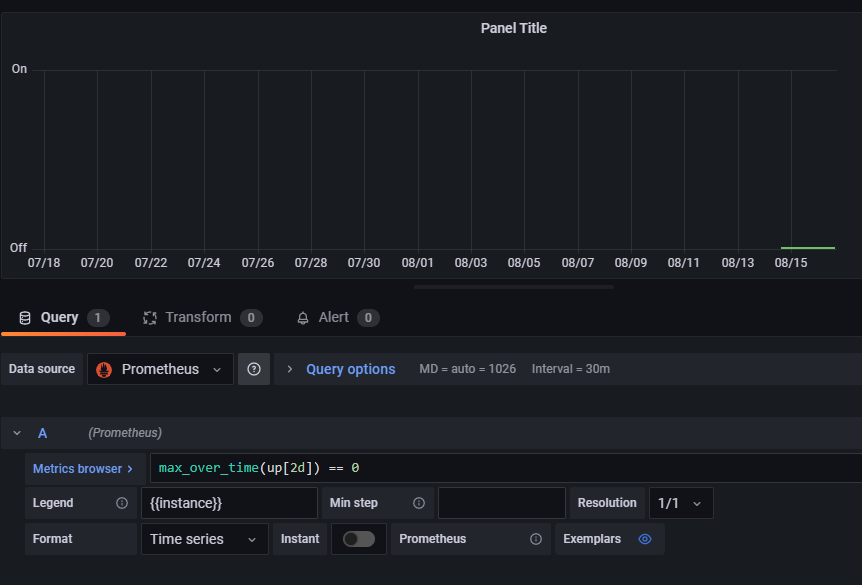
this is the query I am using and the above graph is for 30 days and it is down from the last day. I want the servers that are down for the whole 30 days
Brian Candler
Brian Candler

BHARATH KUMAR
If you want to count the time spent in down state, this becomes more complicated because you have to detect the switch from 1 to 0 which count for 1min and the subsequent down state until the first switch back from 0 to 1.
It could be something along the lines of:
(max_over_time(up[60s]) == bool 0) * ((up offset 61s == bool 1) * count(up[60s]) OR vector(1)) ---> query
But the above query threw me an error as below:
bad_data: 1:73: parse error: expected type instant vector in aggregation expression, got range vector
What I am missing here... How I can achieve this solution like "find the instances that have been completely in down state for last X days"
Thanks & regards,
Bharath Kumar.
Brian Candler
(max_over_time(up[60s]) == bool 0) * ((up offset 61s == bool 1) * count(up[60s]) OR vector(1)) ---> query
But the above query threw me an error as below:
bad_data: 1:73: parse error: expected type instant vector in aggregation expression, got range vector
What I am missing here... How I can achieve this solution like "find the instances that have been completely in down state for last X days"


BHARATH KUMAR
Brian Candler
node_boot_time_seconds is a metric that says when the host itself thinks it booted - which is not necessarily the same as the host has been "up" or "down" from the point of view of Prometheus, which classes "up" as a successful scrape. For example, the host could have been running fine, but the network was down: you'll get up == 0 during the network outage, but node_boot_time_seconds will not have changed.
Question: are you generating alerts when these machines go down? If you are, then the answer is easy: there's a metric ALERTS_FOR_STATE where the value is the time that the alert started. See:
* <https://prometheus.io/docs/prometheus/latest/querying/basics/>
* <https://github.com/infinityworks/prometheus-example-queries>
* <https://timber.io/blog/promql-for-humans/>
* <https://www.weave.works/blog/promql-queries-for-the-rest-of-us/>
* <https://www.slideshare.net/weaveworks/promql-deep-dive-the-prometheus-query-language>
* <https://medium.com/@valyala/promql-tutorial-for-beginners-9ab455142085>
* <https://www.robustperception.io/common-query-patterns-in-promql>
* <https://www.robustperception.io/booleans-logic-and-math>
* <https://www.robustperception.io/composing-range-vector-functions-in-promql>
* <https://www.robustperception.io/rate-then-sum-never-sum-then-rate>
* <https://www.robustperception.io/using-group_left-to-calculate-label-proportions>
* <https://www.robustperception.io/extracting-raw-samples-from-prometheus>
* <https://www.robustperception.io/prometheus-query-results-as-csv/>
* <https://www.robustperception.io/existential-issues-with-metrics>
* <https://www.robustperception.io/left-joins-in-promql>
Brian Candler
You want to know how long have they been down? Do the same as you did with node_boot_time_seconds:time() - max_over_time((time() * up)[24h:]) unless up == 1