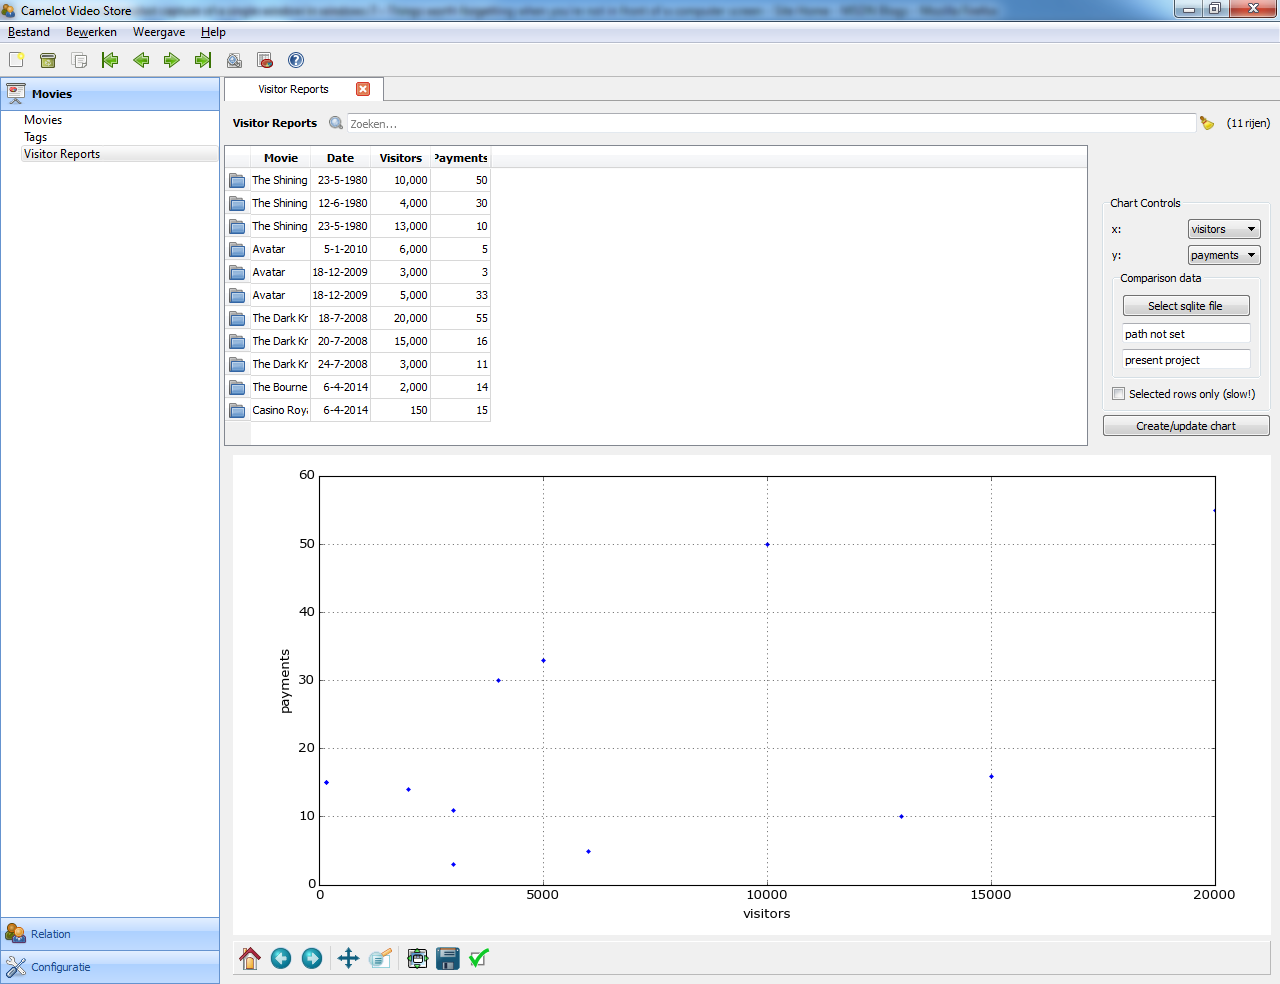
Integration of matplotlib plot

55 views
Skip to first unread message

r.eggers

unread,
Aug 28, 2015, 7:08:14 AM8/28/15
to Project Camelot
Dear All,

Please find attached two modules that are an attempt to add interactive an matplotlib scatter plot inside the table view of Camelot. This is useful for myself. I hope it is useful for others as well. But note I have some questions for possible improvement (see below). This is really a first stab by a Python enthusiast, not production code at all. See some issues and questions below.

There are two modules. The first, "chart_controls", provides GUI elements that can be added to the right column (list_actions) and the code to actually create the chart. The controls allow the user to flexibly select the x and y variable in the plot.

The second (optional) module contains some additional functionality to load a second database and plot data in the same chart with a different color. There is functionality to apply the same header filter values as set in the Camelot GUI at that time although this is only implemented with the Dutch values of the filters (it needs an alternative way to read the filters or internationalisation). Filter in the sidebar are not implemented.

To make it work, simply add the provided classes to and EntityAdmin. The following is an examle for the VisitorReport in the Camelot examples. I have added a fictive "payments" column to the model to have two numbers that can be plotted against each other. This yields the screenshot as attached.

class Admin(EntityAdmin):

      # other elements omitted

      list_actions = [list_actions_box((

                                                        xy_combo_box('x: ', 'xvar', list_display, 'visitors'),

                                                        xy_combo_box('y: ', 'yvar', list_display, 'payments'),

                                                        comparison_data_group_box(),

                                                        use_selection_check_box(),

                                                        ),'Chart Controls'),

                             chart_button(list_display,comp_data_mod = 'model',comp_data_class='VisitorReport'),

                             ]


Some questions for improvement:
  1. Currently, the retrieval of data and the creation of the chart happens in the GUI thread. How could I move it to the model thread? The issue here is that I also would like to have access to gui_context to read the values of the values of some QWidgets.
  2. It would be nice to have a draggable horizontal QSplitter between the chart and the table so that these elements can be resized. Can that be done without editting core Camelot code? I tried to create a QSplitter and add the (already existing) table as a child (see commented out code starting at line 260 in the chart_controls module). This didn't work. I probably don't sufficiently understand the structure of the GUI elements and need to look in the code anyway. If core Camelot code needs to be editted, then where to start?
  3. In order to apply the same filters to the data from the secondary database I read the filter operators (equal to, larger than, ...) from the GUI using the currentText method of the QWidgets. That results in internationalised values. Is there a way to get them in the same language all the time so that my code consistently works? I guess that one method could be to force the language in the application (but not the most elegant solution).
  4. Is there a function call available that directly opens the form for a certain object? I could possibly use it in the plot to open the object belonging to a specific data point.
Regards,

Rogier Eggers
chart_controls.py
comp_data.py
camelot_charts_screenshot.png

r.eggers

unread,
Aug 31, 2015, 8:24:04 AM8/31/15
to Project Camelot
Responding to myself with some new insights (and questions):

Item 2: It seems that in order to have an additional QSplitter below the table and above the chart, I need to modify "view/controls/tableview.py". Is that correct? Will there be other side effects/files to be modified?

Item 3: I can get the actual sql query in the gui_thread from "gui_context.view.get_model().get_query()"
But where can I get the parameters in the WHERE clause? These are still shown as placeholders (% symbols)

It seems much more straightforward to use this directly (to fetch data from a secondary database) rather than searching all qtwidgets to get their value.


Thanks.

Regards,

Rogier

Erik Janssens

unread,
Sep 19, 2015, 4:58:58 AM9/19/15
to project...@googlegroups.com
Question 3 : how to reproduce the filtered query from a table view

the filtered query is 'hidden' within the data model, since the data
model chooses how to do the filtering. 

also, the data model applies other modifications to the query, to
improve loading speed

what you can do instead, is reproduce the query.  since each filter
action has a method 'decorate_query' which applies the clause specific
to that filter to a query.

each filter widget has a mehtod 'get_value' that returns the value
the user selected (not the string representing that value)
--
--
You received this message because you are subscribed to the "Project Camelot" group.
Visit www.python-camelot.com for more information
 
To post to this group, send email to project...@googlegroups.com
To unsubscribe from this group, send email to
project-camel...@googlegroups.com
For more options, visit this group at
http://groups.google.com/group/project-camelot?hl=en

---
You received this message because you are subscribed to the Google Groups "Project Camelot" group.
To unsubscribe from this group and stop receiving emails from it, send an email to project-camel...@googlegroups.com.
For more options, visit https://groups.google.com/d/optout.

Erik Janssens

unread,
Sep 19, 2015, 5:01:48 AM9/19/15
to project...@googlegroups.com
Question 4 : open a form from within the plot

Clicking the data point should trigger an action, this means
calling the gui_run method of an action.

This action can then yield an action step to open the form

(dirty hack : you could also call the gui_run method of an
 action step, but I would not recommend this 'design')


On 2015-08-27 15:31, r.eggers wrote:

Erik Janssens

unread,
Sep 19, 2015, 5:10:27 AM9/19/15
to project...@googlegroups.com
Question 1 : how to transfer additional info from the gui to the model

One way of doing this is :

create a custom action step, eg ExtractData, that in it's gui_run :

1. looks up the widgets it needs through the findObject mechanism of Qt
2. extract the data from the wiget
3. returns that data

then in the model_run of your action, you do :

def model_run(self, model_context):
      data = yield ExtractData()


On 2015-08-27 15:31, r.eggers wrote:

Erik Janssens

unread,
Sep 19, 2015, 5:12:30 AM9/19/15
to project...@googlegroups.com
Question 2 : rearrange the table view

I have no idea :)  Probably the individual widgets can be looked
up by class/name and then rearranged to create a different view


On 2015-08-27 15:31, r.eggers wrote:

r.eggers

unread,
Oct 1, 2015, 7:08:33 AM10/1/15
to Project Camelot, erik.j...@conceptive.be
That seems like a very useful and more robust approach. I see the decorate_query method in three places in admin/action/list_filter.py. It's however not yet clear how to use the method. I have the following questions:
-How can I access the filter action objects from within my code? Can it be found in gui_context or model_context?
-How can I apply the decorate_query? Do I simply define a select statement as in a view and pass the select statement to the decorate_query method?
-Similarly, how can I use the values returned from get_value in this process? Should they also be passed as an argument?

Many thanks for answers, also on the other topics! I'll be ticking them off one by one and then submit improved code to the list in the hope that it is useful (it certainly is to me)!
Reply all
Reply to author
Forward
0 new messages