Calculating p-values for LD
27 views
Skip to first unread message

Drew Hardy
Apr 22, 2022, 6:59:41 PM4/22/22
to poppr
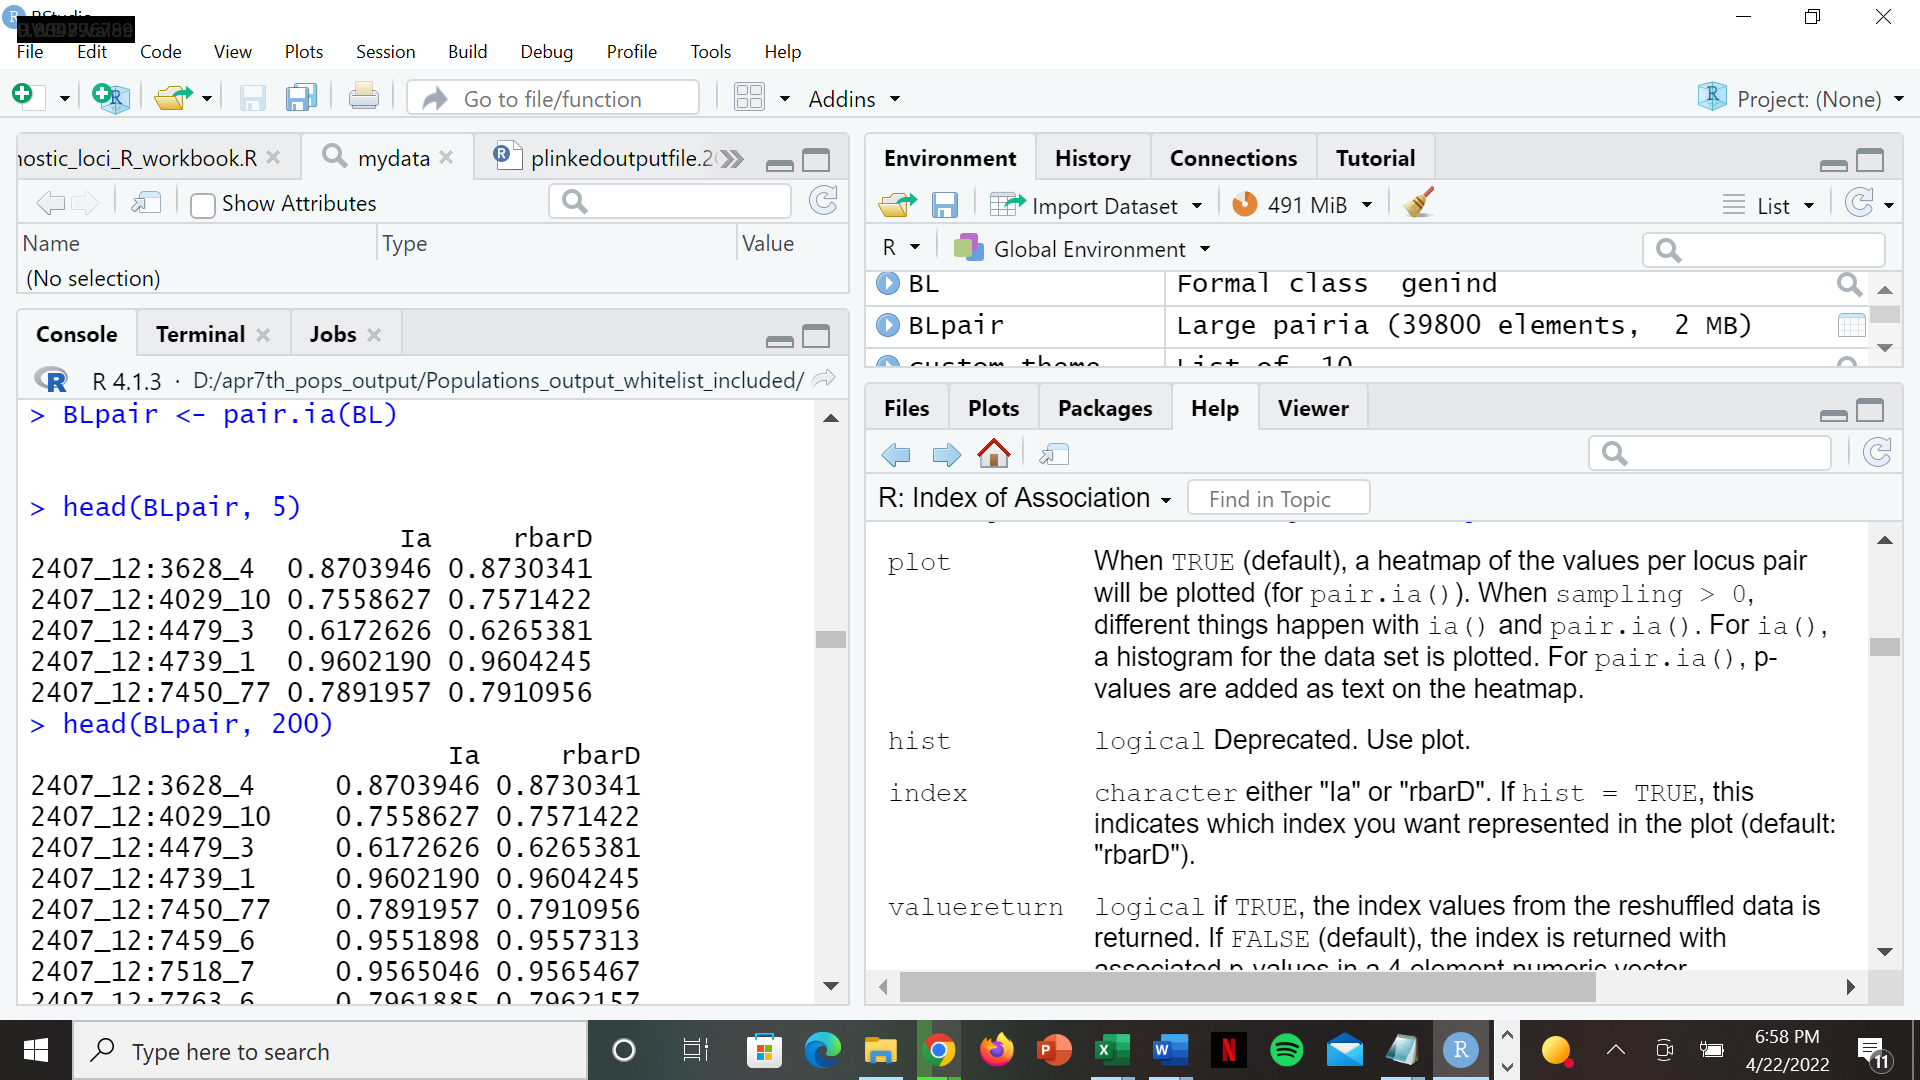
Hello, my name is Drew Hardy, I am working with a snp dataset of 200 loci in 437 diploid individuals split into 14 populations. I am working out of a 'genind' object which has worked well so far. I am new to 'poppr' and R in general and I have calculated linkage disequilibrium in two ways (IA and R-bar_d, both per population) using the following guide (thank you!) and the 'pair.ia' function: https://grunwaldlab.github.io/Population_Genetics_in_R/Linkage_disequilibrium.html
I am hoping to also calculate p-values of significance for each pairwise association, but did not see a way to do this using the guide. I checked out the R documentation help page within R studio and saw that while using 'pair.ia', under the 'plot' argument, "p-values are added as text on the heatmap", and under the 'valuereturn' argument, "if FALSE (default), the index is returned with associated p-values in a 4 element numeric vector". However, when I checked the heatmap plot, I did not see the p-values anywhere on the plot. I would actually prefer to have a column of them next to the IA and rbar_d values anyways. Am I missing an input command for the 'pair.ia' function to automatically include p-values (and maybe error as well) for each pairwise association?
And moving forward, if I am able to generate p-values, with pairwise associations between 200 loci at populations of roughly 30 individuals per pop, is there an easy way to copy this/convert this to a .csv/.tsv for opening in excel to do some simple sorting for significance?
Best,
Drew Hardy
Reply all
Reply to author
Forward
0 new messages