Interpreting "filter_stats" plot
27 views
Skip to first unread message

Victoria Glynn
Apr 14, 2022, 10:43:46 PM4/14/22
to poppr
Dear poppr community,
I hope this finds you well.
I wish to set my MLG cutoff threshold using filter_stats, but I am having issues wrapping my head around my current output.
I have a VCF file with SNP data that I converted into a SNPclone object, and then ran the following commands in R:
thresholds <- filter_stats(gl, distance = bitwise.dist, plot = TRUE)
thresholds
thresholds
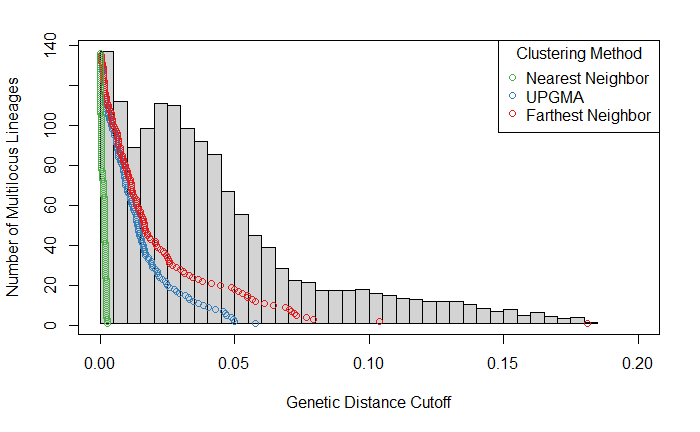
My plot looks as follow:
My questions are as follows:
- I am unsure if I am fully understanding how this plot is made and what it represents, as I would expect that as the genetic distance cut-off increases, the number of MLGs called decreases. However, there is an unexpected second peak in the histogram, close in size to the first one, at around a genetic distance of 0.025.
- From reading the online tutorial, I would interpret the grey histogram in the background to represent the total number of MLGs called at a given genetic distance cutoff. Is the histogram representing cumulative MLGs called across all three clustering methods, or a mean/median amount for all three clustering approaches?
Thank you in advance for your time and help. I really appreciate it.
Best regards,
Victoria

Zhian Kamvar
Apr 15, 2022, 12:36:03 PM4/15/22
to Victoria Glynn, poppr
Hello,
The histogram is an overlay visualisation of the distance matrix (e.g. hist(bitwise.dist(gl)) will give the same plot) and does not correspond to the y-axis (that's on me for not documenting this properly). An explanation of what it represents can be found in https://onlinelibrary.wiley.com/doi/10.1111/j.1365-294X.2007.03535.x#fu2.
It can be helpful in detecting the clonal peak (the first peak of the histogram) and determining a cutoff if there is no clear gap in the thresholds (shown as points on the graph).
--
You received this message because you are subscribed to the Google Groups "poppr" group.
To unsubscribe from this group and stop receiving emails from it, send an email to poppr+un...@googlegroups.com.
To view this discussion on the web visit https://groups.google.com/d/msgid/poppr/a6c4f759-a68a-4965-8dce-86d0aad44335n%40googlegroups.com.
Victoria Glynn
Apr 28, 2022, 2:20:22 PM4/28/22
to poppr
Hello Zhian,
Thank you for your message and for providing further guidance on the plot. It is much appreciated.
Best regards,
Victoria
Reply all
Reply to author
Forward
0 new messages