More on the Hansen paper and the back-and-forth between jim and Michael Mann

H simmens
Here’s another detailed article that focuses more on the back-and-forth between Jim Hansen and Michael Mann and other climate scientists.
What I found perhaps most notable is the acknowledgment that even if the Hansen paper is a more accurate representation of climate dynamics, given the pace and culture of science, it’s not likely to to have much impact for a number of years as the excerpt from the article below demonstrates.
After all, if all you have is a hammer then everything looks like a nail, which in this case means that if the only tool in your toolbox is emission reductions, then all the Hansen paper even means is that we need to do emission reductions only even faster.
Whereas the Hansen paper itself indicates that one of the key policy consequences of his analysis is the urgent need for direct climate intervention, an approach not mentioned at all in the article.
The limitations, and even myopia of current climate science and policy is quite starkly illustrated by the contents of this article. Future generations, if there are any, should zero in on what is said here as a significant reason why climate action is failing without efforts at radical course correction.
Herb
 | |
“Even if the dire conclusion of 2 degrees Celsius of warming is affirmed by peer review, it’s not clear if one new research paper would have much impact on global climate policy, said Glen Peters, a senior climate researcher with the Center for International Climate Research (CICERO) in Oslo.
“Policy makers and decision makers do not generally respond to each new paper that is published, no matter how reputable the author,” he said. “They wait for the consensus view from the IPCC published every 5-10 years. Even so, the policy outcome would be much the same. A sharp increase in climate action is needed, beyond the level that politicians already find unpalatable.”

Tom Goreau
The IPCC system is based on averages of many predictions, regardless of their quality, so it will never separate the gems from the sewage.
Mann is a really great paleoclimatologist, sad to see his misleading statements. Hansen and his team are simply the best in the modeling business.
Thomas J. F. Goreau, PhD
President, Global Coral Reef Alliance
Chief Scientist, Blue Regeneration SL
President, Biorock Technology Inc.
Technical Advisor, Blue Guardians Programme, SIDS DOCK
37 Pleasant Street, Cambridge, MA 02139
gor...@globalcoral.org
www.globalcoral.org
Skype: tomgoreau
Tel: (1) 617-864-4226 (leave message)
Books:
Geotherapy: Innovative Methods of Soil Fertility Restoration, Carbon Sequestration, and Reversing CO2 Increase
http://www.crcpress.com/product/isbn/9781466595392
Innovative Methods of Marine Ecosystem Restoration
http://www.crcpress.com/product/isbn/9781466557734
No one can change the past, everybody can change the future
It’s much later than we think, especially if we don’t think
Those with their heads in the sand will see the light when global warming and sea level rise wash the beach away
Geotherapy: Regenerating ecosystem services to reverse climate change
From: <healthy-planet-...@googlegroups.com> on behalf of H simmens <hsim...@gmail.com>
Date: Monday, May 29, 2023 at 3:10 PM
To: HPAC healthy-planet-action-coalition <healthy-planet-...@googlegroups.com>, Planetary Restoration <planetary-...@googlegroups.com>, via NOAC Meetings <noac-m...@googlegroups.com>
Subject: More on the Hansen paper and the back-and-forth between jim and Michael Mann
Here’s another detailed article that focuses more on the back-and-forth between Jim Hansen and Michael Mann and other climate scientists.
What I found perhaps most notable is the acknowledgment that even if the Hansen paper is a more accurate representation of climate dynamics, given the pace and culture of science, it’s not likely to to have much impact for a number of years as the excerpt from the article below demonstrates.
After all, if all you have is a hammer then everything looks like a nail, which in this case means that if the only tool in your toolbox is emission reductions, then all the Hansen paper even means is that we need to do emission reductions only even faster.
Whereas the Hansen paper itself indicates that one of the key policy consequences of his analysis is the urgent need for direct climate intervention, an approach not mentioned at all in the article.
The limitations, and even myopia of current climate science and policy is quite starkly illustrated by the contents of this article. Future generations, if there are any, should zero in on what is said here as a significant reason why climate action is failing without efforts at radical course correction.
Herb
|
|

|
|
“Even if the dire conclusion of 2 degrees Celsius of warming is affirmed by peer review, it’s not clear if one new research paper would have much impact on global climate policy, said Glen Peters, a senior climate researcher with the Center for International Climate Research (CICERO) in Oslo.
“Policy makers and decision makers do not generally respond to each new paper that is published, no matter how reputable the author,” he said. “They wait for the consensus view from the IPCC published every 5-10 years. Even so, the policy outcome would be much the same. A sharp increase in climate action is needed, beyond the level that politicians already find unpalatable.”
Herb Simmens
@herbsimmens
Author A Climate Vocabulary of the Future
“A Sciencepoem, an Inspiration, A prophecy, also hilarious. Dive in and see.” Kim Stanley Robinson
--
You received this message because you are subscribed to the Google Groups "Healthy Planet Action Coalition (HPAC)" group.
To unsubscribe from this group and stop receiving emails from it, send an email to
healthy-planet-action...@googlegroups.com.
To view this discussion on the web visit
https://groups.google.com/d/msgid/healthy-planet-action-coalition/802BAD51-0D69-4CC1-81AD-751E96D75E9C%40gmail.com.
For more options, visit https://groups.google.com/d/optout.

Bhaskar M V
You received this message because you are subscribed to the Google Groups "NOAC Meetings" group.
To unsubscribe from this group and stop receiving emails from it, send an email to noac-meeting...@googlegroups.com.
To view this discussion on the web visit https://groups.google.com/d/msgid/noac-meetings/7941A156-D0A5-4634-9475-4CBD70894405%40globalcoral.org.

Ye Tao
All the more important to put scissors in ordinary people's
hands, bypassing inertia of established top-down processes. Our
time is most certainly best spent developing bottom up,
ground-based SRM.
Sounds like a logical conclusion, no?
Ye
--
You received this message because you are subscribed to the Google Groups "NOAC Meetings" group.
To unsubscribe from this group and stop receiving emails from it, send an email to noac-meeting...@googlegroups.com.
To view this discussion on the web visit https://groups.google.com/d/msgid/noac-meetings/802BAD51-0D69-4CC1-81AD-751E96D75E9C%40gmail.com.

Peter Fiekowsky
Either we restore the climate-to below 300 ppm CO2 (yes, Hansen says 325, which I'm fine with), or we're dead. Is there anything else to say?

Robert Chris
Peter,
Nicely put.
Unfortunately your straightforward assessment falls apart when we ask who the 'we' are that 'prefer to just restore CO2 to safe levels, and not die'. There are a lot of people who are going to die long before they're extinguished by global warming. Many of them consider restoring CO2 to safe levels to be a serious threat to much of what they value. Most of those that have the power to restore CO2 to safe levels are in that group. Conversely, few of those whose lives are really threatened by global warming and would like to restore CO2 to safe levels have the power to do much about it.
The real choice is between revolution followed by climate induced collapse and climate induced collapse followed by revolution. Not much of a choice, but my money is on the latter. An orderly transition from here to where we need to be is highly unlikely, I would even say, implausible.
My new mantra - Climate change waits for no man or woman (or, to
be truly inclusive, any other gender).
Robert
You received this message because you are subscribed to the Google Groups "Planetary Restoration" group.
To unsubscribe from this group and stop receiving emails from it, send an email to planetary-restor...@googlegroups.com.
To view this discussion on the web visit https://groups.google.com/d/msgid/planetary-restoration/df3d6b5d-b1f3-40c0-a9a5-6b8b994f8e45n%40googlegroups.com.
Robert Chris
I'm really struggling with the detail in Hansen's paper. Here's something simple. Can anyone help with it?
In Line 271 et seq he presents a graph (Fig. 1) of RF, comparing
IPCC AR6 with his calculations. The IPCC data come from AR6 Table
A III.3. The total RF shown in that table is 2.84 W/m2. However,
his Fig 1 and the related text [line 283] refer to the IPCC AR6 RF
of 3.84 W/m2. Then in line 295 he refers to the IPCC RF of 4.14
W/m2. It is this value that he uses throughout the rest of the
paper as the reference RF since 1750. In line 1299 he uses 4.6
W/m2 with reference to mid-Holocene 7kyBP and dismisses the
difference between the two as being immaterial given the current
rate of increase in RF.
These differences may arise from the different definitions of RF but it isn't clear how that has been done.
In addition, in AR6 Table 7.8 2019 total anthropogenic ERF is reported as 2.72 W/m2 while in Table 7.5 it's 2.871 W/m2.
Then in Table 7.2 model-derived RF is reported for F(sst) and ERF
as 3.70 and 3.93 W/m2 respectively. Hansen prefers the use of
F(sst) to ERF - see line 234.
My question is this. Where does the 4.14 W/m2 that is central to
his calculations come from and how are all these different RF
values reconciled?
Robert
You received this message because you are subscribed to the Google Groups "Healthy Planet Action Coalition (HPAC)" group.
To unsubscribe from this group and stop receiving emails from it, send an email to healthy-planet-action...@googlegroups.com.
To view this discussion on the web visit https://groups.google.com/d/msgid/healthy-planet-action-coalition/78888d45-3fe1-a596-8401-c66ec7c6127d%40rowland.harvard.edu.

Michael MacCracken
Hi Peter--A couple of things:
1. The curve, without your addition, is the relative temperature
change in that spot in Antarctica--and so it is NOT the change in
global average temperature. In polar regions one can get
relatively large changes in temperature as there is often a near
surface inversion in temperature and it does not take much energy
to raise the temperature of a thin layer of the atmosphere when at
other latitudes the layer that must be warmed can extend up to the
tropopause. Also the air is very dry as well as cold, and much
easier to heat dry air than moist air given one has to provide the
energy to raise the humidity.
2. I say "relative" because this is not showing the absolute
temperature, but the difference from whatever the annual average
was at that location in say 1950 or so/preindustrial. So, don't
think that the 20 C you get is an absolute temperature as the
actual temperature now at the site is likely minus a several tens
of degrees C.
3. On your scaling, it looks a bit more than linear to me, and indeed should probably be logarithmic as is CO2 forcing, so, going from say 150 to 300 ppm should be the same distance as from 300 to 600, etc. (the actual isotope changes are caused at least in part by changes in the temperature from which the water evaporated, etc.--so that is an additional complication) and likely a lot of other factors come in as one tries to extend it upwards, so I really don't think that is an appropriate thing to do with the paper, and seeming putting it as the first graphic in your presentation with your extension I just don't think is justified.
So, overall, I'd hold back on the diagram you modified and concluding 20 C increase.
Best, Mike
PS--On the paper itself, good to read Jim's monthly post.
You received this message because you are subscribed to the Google Groups "Planetary Restoration" group.
To unsubscribe from this group and stop receiving emails from it, send an email to planetary-restor...@googlegroups.com.
To view this discussion on the web visit https://groups.google.com/d/msgid/planetary-restoration/df3d6b5d-b1f3-40c0-a9a5-6b8b994f8e45n%40googlegroups.com.
Peter Fiekowsky
Robert Chris
Hi Bruce
That's really helpful. Thanks.
Regards
Robert
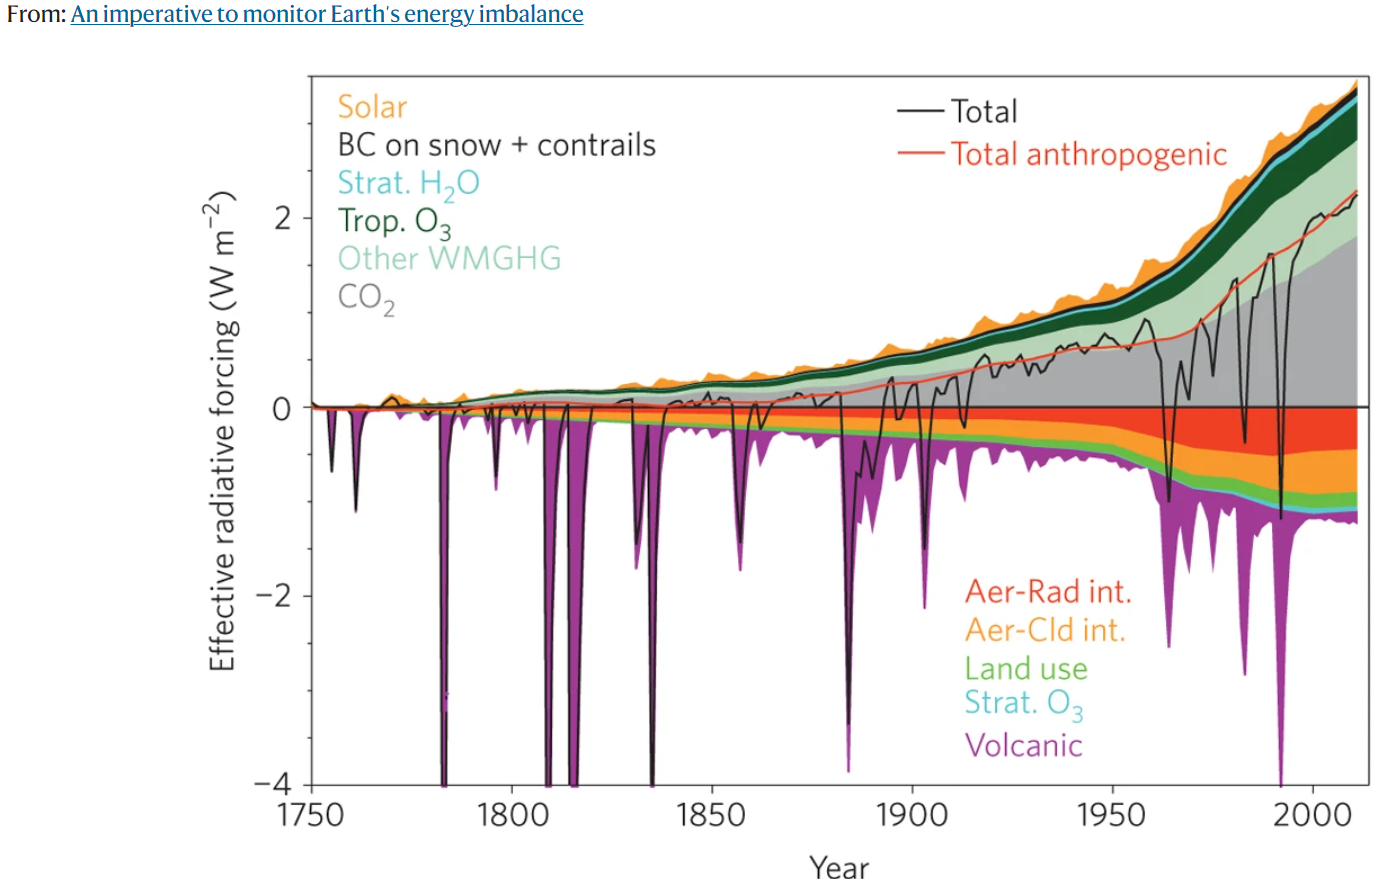
Line 271 et seq he presents a graph (Fig. 1) of RF, comparing IPCC AR6 with his calculations. The IPCC data come from AR6 Table A III.3. The total RF shown in that table is 2.84 W/m2. Figure 1 includes the forcing of only GHGs, excluding the “aerosol masking”, black carbon, etc.
However, his Fig 1 and the related text [line 283] refer to the IPCC AR6 RF of 3.84 W/m2. 3.84 W/m2 = GHG forcing from CO2 + CH4 + NO2 + Halogenated Compounds + O3 + Stratospheric Water Vapour
Then in line 295 he refers to the IPCC RF of 4.14 W/m2 (for 2021). I don’t follow his math. But in the paragraph above he has “The AR6 GHG forcing in 2019 is thus ~ 4.05 W/m2”. Since the AR6 data is through 2019, he probably extrapolated to 2021
In line 1299 he uses 4.6 W/m2 with reference to mid-Holocene 7kyBP The “mid Holocene” must have been a bit cooler than preindustrial 1750
In addition, in AR6 Table 7.8 2019 total anthropogenic ERF is reported as 2.72 W/m2 This is total anthropogenic, which agrees with AR6 Table A III.3
while in Table 7.5 it's 2.871 W/m2. I don’t see the table, but that’s pretty close to 2.84
Then in Table 7.2 model-derived RF is reported for F(sst) and ERF as 3.70 and 3.93 W/m2 respectively Are these relevant based on what you are looking for??
Hope that helps.
Bruce Parker
To view this discussion on the web visit https://groups.google.com/d/msgid/noac-meetings/444f5ad0-ae6a-1611-cd69-6b51a523e8b1%40gmail.com.

rob...@rtulip.net
This diagram quantifies GHG and other contributions to net radiative forcing.
Source is Fig 1 https://www.nature.com/articles/nclimate2876
From: noac-m...@googlegroups.com <noac-m...@googlegroups.com> On Behalf Of Bruce Parker
Sent: Tuesday, May 30, 2023 10:32 PM
To: 'Robert Chris' <robert...@gmail.com>; 'Ye Tao' <t...@rowland.harvard.edu>; 'H simmens' <hsim...@gmail.com>; 'HPAC healthy-planet-action-coalition' <healthy-planet-...@googlegroups.com>; 'Planetary Restoration' <planetary-...@googlegroups.com>; 'via NOAC Meetings' <noac-m...@googlegroups.com>
Subject: RE: More on the Hansen paper and the back-and-forth between jim and Michael Mann
Line 271 et seq he presents a graph (Fig. 1) of RF, comparing IPCC AR6 with his calculations. The IPCC data come from AR6 Table A III.3. The total RF shown in that table is 2.84 W/m2. Figure 1 includes the forcing of only GHGs, excluding the “aerosol masking”, black carbon, etc.
However, his Fig 1 and the related text [line 283] refer to the IPCC AR6 RF of 3.84 W/m2. 3.84 W/m2 = GHG forcing from CO2 + CH4 + NO2 + Halogenated Compounds + O3 + Stratospheric Water Vapour
Then in line 295 he refers to the IPCC RF of 4.14 W/m2 (for 2021). I don’t follow his math. But in the paragraph above he has “The AR6 GHG forcing in 2019 is thus ~ 4.05 W/m2”. Since the AR6 data is through 2019, he probably extrapolated to 2021
In line 1299 he uses 4.6 W/m2 with reference to mid-Holocene 7kyBP The “mid Holocene” must have been a bit cooler than preindustrial 1750
In addition, in AR6 Table 7.8 2019 total anthropogenic ERF is reported as 2.72 W/m2 This is total anthropogenic, which agrees with AR6 Table A III.3
while in Table 7.5 it's 2.871 W/m2. I don’t see the table, but that’s pretty close to 2.84
Then in Table 7.2 model-derived RF is reported for F(sst) and ERF as 3.70 and 3.93 W/m2 respectively Are these relevant based on what you are looking for??
Hope that helps.
Bruce Parker
From: noac-m...@googlegroups.com [mailto:noac-m...@googlegroups.com] On Behalf Of Robert Chris
Sent: Tuesday, May 30, 2023 11:44 AM
To: Ye Tao; H simmens; HPAC healthy-planet-action-coalition; Planetary Restoration; via NOAC Meetings
Subject: Re: More on the Hansen paper and the back-and-forth between jim and Michael Mann
I'm really struggling with the detail in Hansen's paper. Here's something simple. Can anyone help with it?
In Line 271 et seq he presents a graph (Fig. 1) of RF, comparing IPCC AR6 with his calculations. The IPCC data come from AR6 Table A III.3. The total RF shown in that table is 2.84 W/m2. However, his Fig 1 and the related text [line 283] refer to the IPCC AR6 RF of 3.84 W/m2. Then in line 295 he refers to the IPCC RF of 4.14 W/m2. It is this value that he uses throughout the rest of the paper as the reference RF since 1750. In line 1299 he uses 4.6 W/m2 with reference to mid-Holocene 7kyBP and dismisses the difference between the two as being immaterial given the current rate of increase in RF.
These differences may arise from the different definitions of RF but it isn't clear how that has been done.
In addition, in AR6 Table 7.8 2019 total anthropogenic ERF is reported as 2.72 W/m2 while in Table 7.5 it's 2.871 W/m2.
Then in Table 7.2 model-derived RF is reported for F(sst) and ERF as 3.70 and 3.93 W/m2 respectively. Hansen prefers the use of F(sst) to ERF - see line 234.
My question is this. Where does the 4.14 W/m2 that is central to his calculations come from and how are all these different RF values reconciled?
Regards
Robert
On 30/05/2023 12:24, Ye Tao wrote:
All the more important to put scissors in ordinary people's hands, bypassing inertia of established top-down processes. Our time is most certainly best spent developing bottom up, ground-based SRM.
Sounds like a logical conclusion, no?
Ye
On 5/29/2023 3:10 PM, H simmens wrote:
Here’s another detailed article that focuses more on the back-and-forth between Jim Hansen and Michael Mann and other climate scientists.
What I found perhaps most notable is the acknowledgment that even if the Hansen paper is a more accurate representation of climate dynamics, given the pace and culture of science, it’s not likely to to have much impact for a number of years as the excerpt from the article below demonstrates.
After all, if all you have is a hammer then everything looks like a nail, which in this case means that if the only tool in your toolbox is emission reductions, then all the Hansen paper even means is that we need to do emission reductions only even faster.
Whereas the Hansen paper itself indicates that one of the key policy consequences of his analysis is the urgent need for direct climate intervention, an approach not mentioned at all in the article.
The limitations, and even myopia of current climate science and policy is quite starkly illustrated by the contents of this article. Future generations, if there are any, should zero in on what is said here as a significant reason why climate action is failing without efforts at radical course correction.
Herb

“Even if the dire conclusion of 2 degrees Celsius of warming is affirmed by peer review, it’s not clear if one new research paper would have much impact on global climate policy, said Glen Peters, a senior climate researcher with the Center for International Climate Research (CICERO) in Oslo.
“Policy makers and decision makers do not generally respond to each new paper that is published, no matter how reputable the author,” he said. “They wait for the consensus view from the IPCC published every 5-10 years. Even so, the policy outcome would be much the same. A sharp increase in climate action is needed, beyond the level that politicians already find unpalatable.”
Herb Simmens
@herbsimmens
Author A Climate Vocabulary of the Future
“A Sciencepoem, an Inspiration, A prophecy, also hilarious. Dive in and see.” Kim Stanley Robinson
--
You received this message because you are subscribed to the Google Groups "NOAC Meetings" group.
To unsubscribe from this group and stop receiving emails from it, send an email to noac-meeting...@googlegroups.com.
To view this discussion on the web visit https://groups.google.com/d/msgid/noac-meetings/802BAD51-0D69-4CC1-81AD-751E96D75E9C%40gmail.com.
--
You received this message because you are subscribed to the Google Groups "Healthy Planet Action Coalition (HPAC)" group.
To unsubscribe from this group and stop receiving emails from it, send an email to healthy-planet-action...@googlegroups.com.
To view this discussion on the web visit https://groups.google.com/d/msgid/healthy-planet-action-coalition/78888d45-3fe1-a596-8401-c66ec7c6127d%40rowland.harvard.edu.
For more options, visit https://groups.google.com/d/optout.
--
You received this message because you are subscribed to the Google Groups "NOAC Meetings" group.
To unsubscribe from this group and stop receiving emails from it, send an email to noac-meeting...@googlegroups.com.
To view this discussion on the web visit https://groups.google.com/d/msgid/noac-meetings/444f5ad0-ae6a-1611-cd69-6b51a523e8b1%40gmail.com.
--
You received this message because you are subscribed to the Google Groups "NOAC Meetings" group.
To unsubscribe from this group and stop receiving emails from it, send an email to noac-meeting...@googlegroups.com.
To view this discussion on the web visit https://groups.google.com/d/msgid/noac-meetings/00fc01d9933e%242fb9a010%248f2ce030%24%40chesdata.com.

Bruce Parker
Line 271 et seq he presents a graph (Fig. 1) of RF, comparing IPCC AR6 with his calculations. The IPCC data come from AR6 Table A III.3. The total RF shown in that table is 2.84 W/m2. Figure 1 includes the forcing of only GHGs, excluding the “aerosol masking”, black carbon, etc.
However, his Fig 1 and the related text [line 283] refer to the IPCC AR6 RF of 3.84 W/m2. 3.84 W/m2 = GHG forcing from CO2 + CH4 + NO2 + Halogenated Compounds + O3 + Stratospheric Water Vapour
Then in line 295 he refers to the IPCC RF of 4.14 W/m2 (for 2021). I don’t follow his math. But in the paragraph above he has “The AR6 GHG forcing in 2019 is thus ~ 4.05 W/m2”. Since the AR6 data is through 2019, he probably extrapolated to 2021
In line 1299 he uses 4.6 W/m2 with reference to mid-Holocene 7kyBP The “mid Holocene” must have been a bit cooler than preindustrial 1750
In addition, in AR6 Table 7.8 2019 total anthropogenic ERF is reported as 2.72 W/m2 This is total anthropogenic, which agrees with AR6 Table A III.3
while in Table 7.5 it's 2.871 W/m2. I don’t see the table, but that’s pretty close to 2.84
Then in Table 7.2 model-derived RF is reported for F(sst) and ERF as 3.70 and 3.93 W/m2 respectively Are these relevant based on what you are looking for??
Hope that helps.
Bruce Parker
From: noac-m...@googlegroups.com [mailto:noac-m...@googlegroups.com] On Behalf Of Robert Chris
Sent: Tuesday, May 30, 2023 11:44 AM
To: Ye Tao; H simmens; HPAC healthy-planet-action-coalition; Planetary Restoration; via NOAC Meetings
Subject: Re: More on the Hansen paper and the back-and-forth between jim and Michael Mann
I'm really struggling with the detail in Hansen's paper. Here's something simple. Can anyone help with it?
To view this discussion on the web visit https://groups.google.com/d/msgid/noac-meetings/444f5ad0-ae6a-1611-cd69-6b51a523e8b1%40gmail.com.

Bruce Melton -- Austin, Texas
Did Hansen lower his "probably less than 350 ppm CO2" from Target Atmospheric CO2... (2008), to 325 ppm?
Thanks,
Bruce
Director, Climate Change Now Initiative, 501c3
President, Melton Engineering Services Austin
8103 Kirkham Drive
Austin, Texas 78736
(512)799-7998
ClimateDiscovery.org
ClimateChangePhoto.org
MeltonEngineering.com
Face...@Bruce.Melton.395
Inst...@Bruce.C.Melton
The Band Climate Change
Twitter - BruceCMelton1
To view this discussion on the web visit https://groups.google.com/d/msgid/planetary-restoration/CAEr4H2%3D8MdkmaXOqsiPtaZbWy7_%3DFvCKS6evqFg1HUD1_G-6%3DQ%40mail.gmail.com.
Robert Chris
Hi Bruce
I undertook to get back to you once I'd finished my review of the Hansen paper. Attached is my email to Hansen which is hopefully self-explanatory, and attached to that is my commentary.
I'd really welcome any comments you might have on any of this.
I haven't yet sent it to anyone else. I'd
like to get some feedback before I inflict it on the wider
world.
Robert
Robert Chris
Hi All
I clicked send too soon! Having said I
wasn't sending this to anyone else yet, I just sent it to
everyone! Doh!
It's done. I'd welcome feedback from
wherever. But please do not circulate it elsewhere until I've
had the benefit of having its rough edges smoothed off.
Robert

John Fitzgerald
To view this discussion on the web visit https://groups.google.com/d/msgid/noac-meetings/84ac9c2f-63cd-4886-6200-dc3c5a4ba0b8%40gmail.com.