norm_taxon_function_contrib column in startified output
77 views
Skip to first unread message

Vincent Darbot
Apr 14, 2022, 11:48:55 AM4/14/22
to picrust-users
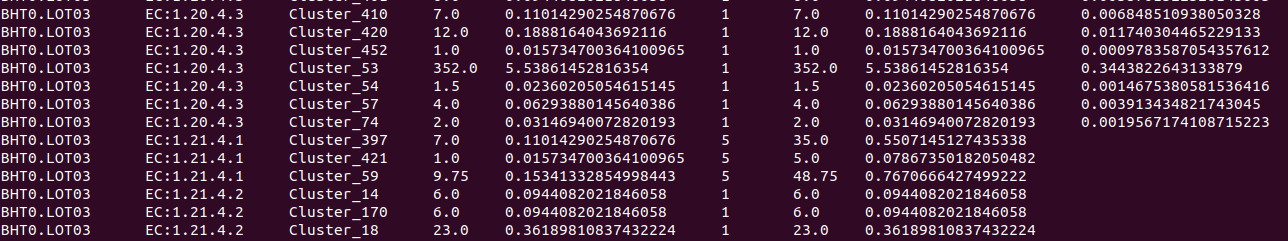
Hello, I did not understand the meaning of the column norm_taxon_function_contrib , in the picrust2 stratified output. Can you please explain me ?
Furthermore , as you can see in attachment, there is a large number of rows for each there are no values for this column, how can we explain this ?
Thank you by advance ,
Vincent

Gavin Douglas
Apr 21, 2022, 10:42:37 AM4/21/22
to picrus...@googlegroups.com
Hey Vincent,
Sorry for the delayed response - I missed this message.
It should be the proportion of that function’s abundance (in that particular sample) that is contributed by that particular taxon (e.g., ASV).
Those cells should not be empty and that is definitely an issue. What exact command did you run and with what version?
If you don’t mind sharing your input files by email, I could help troubleshoot this better.
Cheers,
Gavin
--
You received this message because you are subscribed to the Google Groups "picrust-users" group.
To unsubscribe from this group and stop receiving emails from it, send an email to picrust-user...@googlegroups.com.
To view this discussion on the web visit https://groups.google.com/d/msgid/picrust-users/b6a1f64f-af23-4ef4-ac0c-d2150eb18395n%40googlegroups.com.
<stratified_output.png>
Gavin Douglas
Apr 28, 2022, 3:00:26 PM4/28/22
to picrus...@googlegroups.com
Thanks again for raising this issue. I fixed the bug and made a new release (https://github.com/picrust/picrust2/releases) that is now working.
All the best,
Gavin
Reply all
Reply to author
Forward
0 new messages