1-D nms solution
331 views
Skip to first unread message

nina nikolic
Feb 5, 2013, 11:21:53 AM2/5/13
to pc-...@googlegroups.com
Dear PC-ORD friends,
1. is a consistent 1-dimensional NMS solution a perfectly legitimate result? I mean, does only 1 dimension necessarily indicate that something is wrong? I have not seen much of published work with only one ordination axis interpreted, but then I do not have much experience either. My 1-D NMS ordination (about 80% of the variation represented by the axis) makes enough ecological sense to me.
2. clearly a joint plot can not be produced for 1-D solution. I would like to overlay the most important environmental variables on my ordination results. I have tried the "overlay second matrix" option (one env. variable at the time is ok for my purpose), but there I encountered two issues I do not know how to handle:
a) plotting of SPECIES seems possible only when I overlay a CATEGORICAL variable; for quantitative variables I get species names preserved on the graph, but the points (denoting species central tendencies) are not shown. Moreover, species names remain outside of the graph in many cases, and this is annoying, because I do not understand what does it mean. Am I doing something wrong?
b) envelope curves produced by overlaying env. variables from the second matrix over my 1-D NMS ordination are often interrupted. What does it mean, and how should I interpret this? And, what is the meaning of the "envelope curves" when SECOND matrix is overlaid anyway?
Thanks a lot for any support, I am totally stacked with this issue!

Bruce McCune
Feb 5, 2013, 12:22:33 PM2/5/13
to pc-...@googlegroups.com
Sure, a 1D solution can be fine. Most ecological data sets are complex
enough that multiple dimensions are helpful, but some datasets simply
have only one dominant gradient in the species data.
On the other hand, 1D solutions are common when there is a problem. For example, a single, very strong outlier will be represented by a 1D solution. Or consider a data set where there is one species with overwhelming abundance compared to the other species. That single species dominates the signal in the distance matrix, so that all that NMS needs to do to get low stress is to represent that one species. But if your 1D pattern is well distributed across species and sample units, it should be ok.
As for overlays, the envelope curves are a good way to go, both for species and environmental variables. These curves are made by nonparametric regression, using a kernel smoother, so they don't assume a straight-line response. The "envelope" comes from being able to fit the curve to the upper side of the point cloud so that the line includes most of the points rather than bisecting it. Gaps in the curves are places where you have insufficient data to estimate the curve, or where the envelope extends off the top of the graph panel. If you have the latter problem, try changing the standard deviation parameter for the envelope function to zero, so that the line goes through the central tendency of the points.
I'm not sure what is happening, when you say you have to overlay a categorical variable, nor do understand what you wrote about the species names outside the graph.
Note that for 1D graphs there are several basic options on how they are displayed. See under the "Axis" menu: jittered/not, rank vs. not, Here is an example that is not jittered, not on rank order, and "1 only horizontal" selected.

Hope this helps.
Bruce McCune
On the other hand, 1D solutions are common when there is a problem. For example, a single, very strong outlier will be represented by a 1D solution. Or consider a data set where there is one species with overwhelming abundance compared to the other species. That single species dominates the signal in the distance matrix, so that all that NMS needs to do to get low stress is to represent that one species. But if your 1D pattern is well distributed across species and sample units, it should be ok.
As for overlays, the envelope curves are a good way to go, both for species and environmental variables. These curves are made by nonparametric regression, using a kernel smoother, so they don't assume a straight-line response. The "envelope" comes from being able to fit the curve to the upper side of the point cloud so that the line includes most of the points rather than bisecting it. Gaps in the curves are places where you have insufficient data to estimate the curve, or where the envelope extends off the top of the graph panel. If you have the latter problem, try changing the standard deviation parameter for the envelope function to zero, so that the line goes through the central tendency of the points.
I'm not sure what is happening, when you say you have to overlay a categorical variable, nor do understand what you wrote about the species names outside the graph.
Note that for 1D graphs there are several basic options on how they are displayed. See under the "Axis" menu: jittered/not, rank vs. not, Here is an example that is not jittered, not on rank order, and "1 only horizontal" selected.
Hope this helps.
Bruce McCune
--
You received this message because you are subscribed to the Google Groups "PC-ORD" group.
To unsubscribe from this group and stop receiving emails from it, send an email to pc-ord+un...@googlegroups.com.
For more options, visit https://groups.google.com/groups/opt_out.
nina nikolic
Feb 6, 2013, 7:15:21 AM2/6/13
to pc-...@googlegroups.com
Dear Prof. McCune, thank you very much for your prompt help. PC-ORD users are truly privileged!
I will try to illustrate my problem here, briefly:
I will try to illustrate my problem here, briefly:
Background: 1-D solution. Data matrix: 90 variables (species), 48 samples, ordinal transform values (OTV) relativized by SU totals, Sorensen distance. Final stress: 17.07, instability 0.00000, after 30 iterations.
Now: Overlay Second matrix: Variable FOREST is categorical, everything looks OK, my species can be shown:

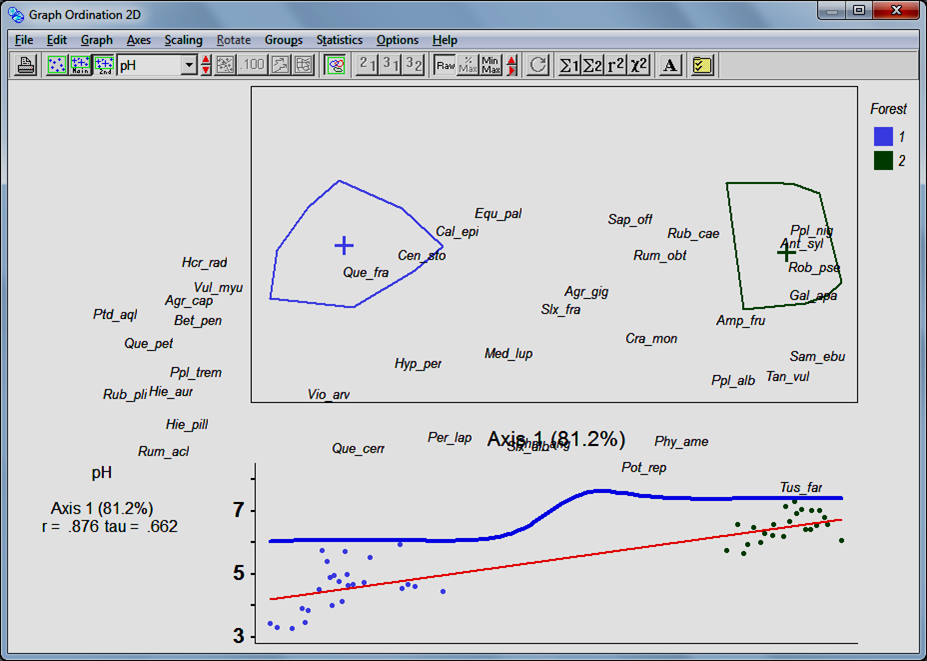
However, when I
overlay a quantitative variable from the second matrix (e.g. pH), the graph gets
scrambled like this above!
This is a problem for me because I need to present SPECIES CENTRAL TENDENCIES AND an ENV. VARIABLE on the same graph, but it looks terrible.
Is there any help?nina nikolic
Feb 6, 2013, 7:42:07 AM2/6/13
to pc-...@googlegroups.com
I assume that it is simply not possible to present both the species as points AND the environmental var. overlaid at the same graph, right?
Bruce McCune
Feb 6, 2013, 10:53:30 AM2/6/13
to pc-...@googlegroups.com
Nina, Thanks for sending the example, that helps. Normally if you choose
the overlay with "side scatterplots" it shows only the rows in
the main matrix and does not display the species (column) points or their
labels. It looks like you have somehow managed to turn on the species
labels but turn off the row points, row labels, and column points. If I
try this, it shows only the convex hulls and no species labels.
I will check into this further and get back to you.
Bruce McCune
I will check into this further and get back to you.
Bruce McCune
nina nikolic
Feb 6, 2013, 11:58:58 AM2/6/13
to pc-...@googlegroups.com
Dear Prof. McCune, right, something unusual happens:
1. First I open the "simple scatterplot" display, and in the Preferences choose to show variables, not samples; I label some species of my choice.
2. Next, I press the "overlay second matrix" button, and my species, and their labels selected in the previous step, remain on the new graph! Yet, if NOW I open the Preferences dialog, it shows that variables can not be shown! So, I have the species shown as points, but this possibility is actually not envisaged in the preferences.
3. It looks decent as long as the environmental variable is the first one in my second matrix; in my case this incidentally is a categorical variable named "forest". However, when I try to present an overlay with the next env. variable (incidentally, all except the first one in my case are quantitative), the graph gets scrambled, and species points displaced to strange positions...
Thanks!
1. First I open the "simple scatterplot" display, and in the Preferences choose to show variables, not samples; I label some species of my choice.
2. Next, I press the "overlay second matrix" button, and my species, and their labels selected in the previous step, remain on the new graph! Yet, if NOW I open the Preferences dialog, it shows that variables can not be shown! So, I have the species shown as points, but this possibility is actually not envisaged in the preferences.

3. It looks decent as long as the environmental variable is the first one in my second matrix; in my case this incidentally is a categorical variable named "forest". However, when I try to present an overlay with the next env. variable (incidentally, all except the first one in my case are quantitative), the graph gets scrambled, and species points displaced to strange positions...
Thanks!
Reply all
Reply to author
Forward
0 new messages