Memory leak in grizzly

Ryan de Laplante
Internal Exception: java.sql.SQLException: I/O Error: Read timed out
Error Code: 0

Fabio Luis - Vanguarda TI
I had a similar problem in the past, and it's cost me some months too.
In my case it was a client application that did not close the connections. As its query frequency was at each 5 minutos, in one week we had 2016 locked connections, giving us the famous OutOfMemory.
I don't know why a timeout didn't occur and closed the idle connections, but my guess is that it has to do with TCP idle connections in Operating System (my case Linux), as the keep alive timeout is set up.
We asked the client to fix his application and close the connections before making new ones, and it solved the problem.
--
You received this message because you are subscribed to the Google Groups "Payara Forum" group.
To unsubscribe from this group and stop receiving emails from it, send an email to payara-forum...@googlegroups.com.
To view this discussion on the web, visit https://groups.google.com/d/msgid/payara-forum/16b976a0-daa7-4a58-89b1-81b40836636cn%40googlegroups.com.
Ryan de Laplante
Ryan de Laplante

Will Hartung
For years we've had to occasionally kill the GlassFish/Payara java.exe process because it ran out of memory and became completely unresponsive, using 95% CPU. I originally thought it was related to JDBC connections going bad because the server.log ALWAYS starts with this:Exception [EclipseLink-4002] (Eclipse Persistence Services - 2.7.7.payara-p2): org.eclipse.persistence.exceptions.DatabaseException
Internal Exception: java.sql.SQLException: I/O Error: Read timed out
Error Code: 0Which eventually leads to a bunch of these:java.sql.SQLException: java.lang.reflect.UndeclaredThrowableExceptionCaused by: java.lang.reflect.InvocationTargetExceptionCaused by: java.sql.SQLException: Invalid state, the Connection object is closed.We're using the jTDS JDBC driver v1.3.1 with MSSQL server over the internal network. We have the connection pools configured to verify connections before use and to close all connections on discovery of a failure. I'd expect it to recover automatically, but it doesn't.
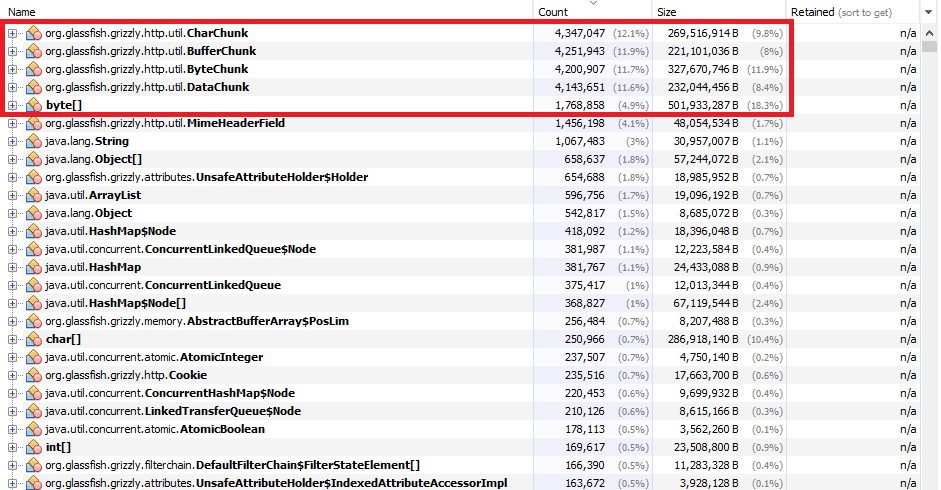
The issue happened again today. This time I used jmap to get a heap dump and ran it through Visual VM to get some clues. What I found is that there are over 4 million (each) of org.glassfish.grizzly.http.util.CharChunk/BufferChunk/ByteChunk/DataChunk objects using almost 1.5 GB of memory. I've attached a screenshot. This leads me to believe there is a memory leak in grizzly, the HTTP(S) web server component in the Payara application server.
The website hosted in Payara is a high traffic website. When the DB becomes unusable, I'm sure many people are clicking over and over while more new users connect to the web server. That should not cause Payara to go to 95% CPU solid, cause the memory to balloon, or make the website become completely unresponsive. When this issue happens, we test the DB and find that it is up and running fine. When we restart Payara, the DB connections work without issue.
Any suggestions to help further diagnose and fix this issue would be greatly appreciated.

Gregor Kovač
Hi!
Will, nice write-up. Gave me some ideas how to solve one of our long standing problems with Glassfish.
Just couple of questions:
- can you please provide the command-line options of jmap you used to find your memory leak?
- when I try to run jmap against my GlassFish like "jmap PID" I
get "Error attaching to process:
sun.jvm.hotspot.debugger.DebuggerException: Can't attach to the
process". I can attach with my NetBeans debugger to Glassfish.
What am I missing with jmap?
Best regards,
Gregor
--
You received this message because you are subscribed to the Google Groups "Payara Forum" group.
To unsubscribe from this group and stop receiving emails from it, send an email to payara-forum...@googlegroups.com.
To view this discussion on the web, visit https://groups.google.com/d/msgid/payara-forum/CAKMEDdzLwNTJS6RRyb91YUV%3DyNN%2BAvs6-SozcyJDGqtcbQdV%2Bw%40mail.gmail.com.
Ryan de Laplante (Personal)
This application processes millions of transactions. Some customers experience this issue maybe 1 - 3 times per year, while others experience it every month or two. When it happens, it's quick to go down, not a slow buildup. I've always suspected a DB issue (such as full backups) or a flaky network issue. Other applications hosted on other servers that communicate with the same DB do not have an issue, although they are .NET and PHP apps.
I know Grizzly is a mature product. My application has been running on Payara since it was called Sun Java System Application Server, before Grizzly even existed. Just because Grizzly is a mature product doesn't mean there isn't an obscure bug or memory leak lurking in there somewhere triggered by a rare, strange network issue. It's always a possibility and I was hoping someone might be willing and able to help me look into that possibility a bit deeper. If it really is Payara's issue, finding and fixing it will benefit everyone. If it's my application code's fault, I'm happy to admit it and share the gained knowledge with everyone.
I've attached a partial log that begins where we started seeing issues today. There are many warnings about tasks being delayed and a "huge system clock jump". That's a big clue. I'm pretty sure this customer is hosting on VMs. If the VM becomes very sluggish, that may be triggering these issues, whatever they are.
Thanks,
Ryan
Will Hartung
I've attached a partial log that begins where we started seeing issues today. There are many warnings about tasks being delayed and a "huge system clock jump". That's a big clue. I'm pretty sure this customer is hosting on VMs. If the VM becomes very sluggish, that may be triggering these issues, whatever they are.
Local Exception Stack:
Internal Exception: java.sql.SQLException: I/O Error: Read timed out
at java.base/java.net.SocketInputStream.socketRead0(Native Method)
at java.base/java.net.SocketInputStream.socketRead(SocketInputStream.java:115)
at java.base/java.net.SocketInputStream.read(SocketInputStream.java:168)
at java.base/java.net.SocketInputStream.read(SocketInputStream.java:140)
at java.base/java.io.DataInputStream.readFully(DataInputStream.java:200)
at java.base/java.io.DataInputStream.readFully(DataInputStream.java:170)
at net.sourceforge.jtds.jdbc.SharedSocket.readPacket(SharedSocket.java:850)
javax.persistence.PessimisticLockException: Exception [EclipseLink-4002] (Eclipse Persistence Services - 2.7.7.payara-p2): org.eclipse.persistence.exceptions.DatabaseException
Internal Exception: java.sql.SQLException: I/O Error: Read timed out
at com.ijws.webcico.dao.impl.StatsDaoJpaImpl.findStatsForNewTransaction(StatsDaoJpaImpl.java:85)
at com.ijws.webcico.service.impl.TransactionHistoryServiceImpl.loadOrCreateStatsEntity(TransactionHistoryServiceImpl.java:359)
at com.ijws.webcico.service.impl.TransactionHistoryServiceImpl.updateStats(TransactionHistoryServiceImpl.java:291)
at com.ijws.webcico.service.impl.TransactionHistoryServiceImpl.recordTransaction(TransactionHistoryServiceImpl.java:213)
at com.ijws.webcico.service.impl.WebCheckInOutServiceImpl.recordError(WebCheckInOutServiceImpl.java:2786)
at com.ijws.webcico.service.impl.WebCheckInOutServiceImpl.searchReservations(WebCheckInOutServiceImpl.java:495)
at com.ijws.webcico.web.ui.screens.processingcommands.SearchCommand.execute(SearchCommand.java:163)
Caused by: Exception [EclipseLink-4002] (Eclipse Persistence Services - 2.7.7.payara-p2): org.eclipse.persistence.exceptions.DatabaseException
Internal Exception: java.sql.SQLException: I/O Error: Read timed out
Caused by: java.net.SocketTimeoutException: Read timed out
at java.base/java.net.SocketInputStream.socketRead0(Native Method)
at java.base/java.net.SocketInputStream.socketRead(SocketInputStream.java:115)
at java.base/java.net.SocketInputStream.read(SocketInputStream.java:168)
at java.base/java.net.SocketInputStream.read(SocketInputStream.java:140)
at java.base/java.io.DataInputStream.readFully(DataInputStream.java:200)
at java.base/java.io.DataInputStream.readFully(DataInputStream.java:170)
at net.sourceforge.jtds.jdbc.SharedSocket.readPacket(SharedSocket.java:850)
Local Exception Stack:
Caused by: java.sql.SQLException: java.lang.reflect.UndeclaredThrowableException
Caused by: java.lang.reflect.UndeclaredThrowableException
Caused by: java.lang.reflect.InvocationTargetExceptionCaused by: java.sql.SQLException: Invalid state, the Connection object is closed.
javax.persistence.PersistenceException: Exception [EclipseLink-4002] (Eclipse Persistence Services - 2.7.7.payara-p2): org.eclipse.persistence.exceptions.DatabaseException
Internal Exception: java.sql.SQLException: java.lang.reflect.UndeclaredThrowableException
Internal Exception: java.sql.SQLException: java.lang.reflect.UndeclaredThrowableException
Caused by: java.lang.reflect.InvocationTargetException
Caused by: java.sql.SQLException: Invalid state, the Connection object is closed.
at net.sourceforge.jtds.jdbc.JtdsConnection.prepareStatement(JtdsConnection.java:2486)
at net.sourceforge.jtds.jdbcx.proxy.ConnectionProxy.prepareStatement(ConnectionProxy.java:466)
... 140 more
Local Exception Stack:
Local Exception Stack:
at net.sourceforge.jtds.jdbc.XASupport.raiseXAException(XASupport.java:620)
at net.sourceforge.jtds.jdbc.XASupport.xa_rollback(XASupport.java:452)
at net.sourceforge.jtds.jdbcx.JtdsXAResource.rollback(JtdsXAResource.java:95)

Christoph John
https://sourceforge.net/p/jtds/bugs/772/
Sounds a little like your issue with reads timing out. Can't it be that since connections are unavailable that other connections are created which will increase memory eventually?
Just making a guess...
Cheers,
Chris.
--
You received this message because you are subscribed to the Google Groups "Payara Forum" group.
To unsubscribe from this group and stop receiving emails from it, send an email to payara-forum...@googlegroups.com.
To view this discussion on the web, visit https://groups.google.com/d/msgid/payara-forum/426a089c-16a2-f9d0-7801-f5dc2b0ec272%40ryandelaplante.ca.
--
Christoph John
Software Engineering
T +49 241 557080-28
christo...@macd.com

MACD GmbH
Oppenhoffallee 103
52066 Aachen, Germany
www.macd.com

Amtsgericht Aachen: HRB 8151
Ust.-Id: DE 813021663
Geschäftsführer: George Macdonald
Christoph John
Chris.
To view this discussion on the web, visit https://groups.google.com/d/msgid/payara-forum/e4a1fb58-344e-4da8-4bef-f973d1d9bc52%40macd.com.
Christoph John
Will Hartung
Just couple of questions:- can you please provide the command-line options of jmap you used to find your memory leak?
- when I try to run jmap against my GlassFish like "jmap PID" I get "Error attaching to process: sun.jvm.hotspot.debugger.DebuggerException: Can't attach to the process". I can attach with my NetBeans debugger to Glassfish. What am I missing with jmap.
Will Hartung
Also, do you *only* have problems on machines with clock drift? If yes, I would strongly encourage you to fix that problem first because it can lead to all kind of follow-up problems, e.g. wrong timeouts.
Ryan de Laplante (Personal)
Recently I've been experimenting with Microsoft's latest JDBC driver on my dev environment. We're making plans to test it with one customer soon, in case the issue is the jTDS JDBC driver.
Regarding BSOD, a couple years ago we had another interesting issue. A customer had a security device installed on their network which intercepted all traffic between the firewall and our server, decrypted and looked for potential malicious issues related to mobile devices. I really don't know anything about it other than it somehow only touched traffic for iOS and possibly Android clients. Our web app worked fine for everyone except iPhone users. Somehow when an iPhone user accessed the website, the JVM memory usage immediately began to balloon and would crash Windows within 2 minutes requiring the power to be cycled. We never figured out why but suspected the network security device might be messing with low level TCP/IP packets and screwing something up. We tried re-installing on other VMs and other physical machines, same issue. Because of this issue, the customer did not go live until this year when we tried again. We did a full re-install of everything on a fresh VM, and this time it works fine. Crazy.
You received this message because you are subscribed to a topic in the Google Groups "Payara Forum" group.
To unsubscribe from this topic, visit https://groups.google.com/d/topic/payara-forum/KTgFuW1zsg4/unsubscribe.
To unsubscribe from this group and all its topics, send an email to payara-forum...@googlegroups.com.
To view this discussion on the web, visit https://groups.google.com/d/msgid/payara-forum/e4a1fb58-344e-4da8-4bef-f973d1d9bc52%40macd.com.
Will Hartung
Recently I've been experimenting with Microsoft's latest JDBC driver on my dev environment. We're making plans to test it with one customer soon, in case the issue is the jTDS JDBC driver.
Ryan de Laplante (Personal)
Thanks,
Ryan
Will Hartung
Yes the clock drift issue has shown up on multiple customer servers that encounter this issue, and might be the root cause. We will need to look at this closer. Perhaps it has something to do with multiple VMs sharing the same hardware.
Ryan de Laplante (Personal)
I used to use PostgreSQL with no issues, but customers have MSSQL DBAs, existing clusters and licenses, etc. so we go with what they want.
Thanks,
Ryan
Will Hartung
The driver is a pure Java driver, unless you need to use XA transactions, in which case there is a DLL that goes with it. However, the DLL must be installed on MSSQL Server itself along with the creation of some tables in the master database, assignment of special roles to users, creation of some special stored procedures, configuration of DTC, etc. I had been using XA DataSources because we're using JTA and multiple databases, but I was able to get it working with regular DataSources recently. I'm not done testing, but if it works well then I will consider dumping jTDS because it is no longer maintained (last released in 2013).
I used to use PostgreSQL with no issues, but customers have MSSQL DBAs, existing clusters and licenses, etc. so we go with what they want.
Christoph John
Some references:
https://stackoverflow.com/questions/409932/java-timer-vs-executorservice
https://stackoverflow.com/questions/17588167/what-should-timertask-scheduleatfixedrate-do-if-the-clock-changes
https://stackoverflow.com/questions/18803695/how-is-the-timer-class-in-java-sensitive-to-the-system-clock
https://bugs.java.com/bugdatabase/view_bug.do?bug_id=4290274
So if you really only have problems on the systems with clock drift I'd wager that the jTDS driver and its outdated usage of timers is the culprit.
Cheers,
Chris.
Ryan de Laplante (Personal)
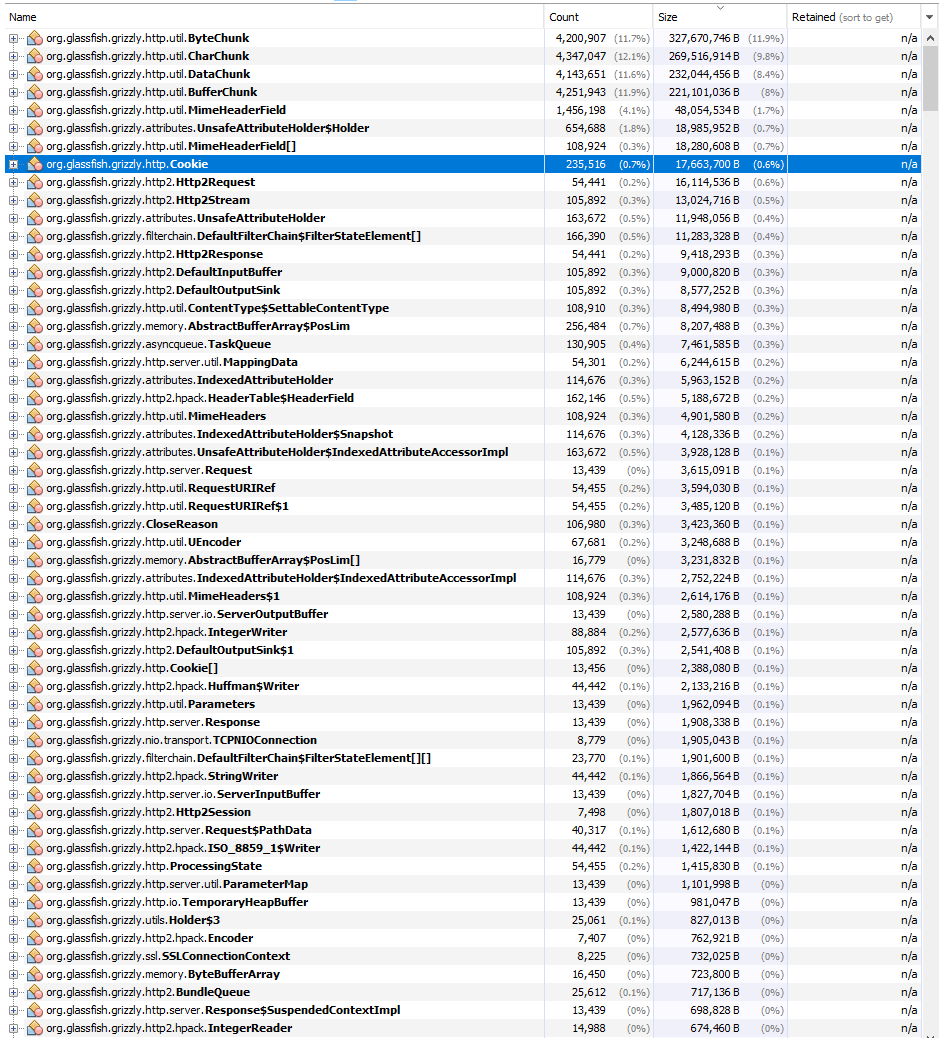
We've been investigating the load of VMs on the shared host, the possibility VM live migration causing pauses, as well as tools the customer might be using to test the web server is up and running. In the past we've seen load balancers doing strange things like connecting and doing SSL handshaking every five seconds then closing the socket before a response is ever sent. Just loading the "home page" of the web app causes a JSESSIONID cookie to be created. They expire after 30 minutes. The heap dump we took the other day had hundreds of thousands of cookies which is suspicious. Possible DDOS? I should generate periodic thread dumps like Will suggested.
Thanks,
Ryan
Ryan de Laplante
79 SSL handshaking - I think (blocked)
4 SSL handshaking - I think (runnable)
4 DB access (runnable)
1 proprietary JCA connector access (runnable)
10 rendering JSF page (runnable)
1 rendering JSF page (blocked)
1 payara logging an exception (runnable)
All of that SSL handshaking probably contributed to the 95% CPU usage of the java.exe process.
I also looked at a random sampling of the over 235,000 cookies in memory. I'm seeing all kinds of cookies that are not used by our application. Cookies for various analytics platforms that we don't use. I'm starting to think this could be a DoS/DDoS attack on CPU and memory. Perhaps seemingly real cookies are sent in the request just to fill memory. If it is DoS, perhaps rate limiting at the firewall might help if not already in place. Note that killing the java.exe process and starting it back up again resolves the issue until next time though.
Below are a couple stack dumps from threads doing what I think is SSL handshaking:
"http-thread-pool::http-listener-2(2)" daemon prio=5 tid=75 BLOCKED
at org.glassfish.grizzly.http2.AlpnSupport.setConnection(AlpnSupport.java:77)
local variable: sun.security.ssl.SSLEngineImpl#7894
local variable: org.glassfish.grizzly.nio.transport.TCPNIOConnection#8308
local variable: java.util.WeakHashMap#537
at org.glassfish.grizzly.http2.AlpnSupport.access$500(AlpnSupport.java:46)
at org.glassfish.grizzly.http2.AlpnSupport$1.onStart(AlpnSupport.java:146)
local variable: sun.security.ssl.SSLEngineImpl#7894
local variable: org.glassfish.grizzly.http2.AlpnServerNegotiatorImpl#1
at org.glassfish.grizzly.ssl.SSLBaseFilter.notifyHandshakeStart(SSLBaseFilter.java:996)
local variable: org.glassfish.grizzly.nio.transport.TCPNIOConnection#8308
local variable: java.util.concurrent.ConcurrentHashMap$KeyIterator#77
at org.glassfish.grizzly.ssl.SSLBaseFilter$SSLTransportFilterWrapper.handleRead(SSLBaseFilter.java:1119)
local variable: org.glassfish.grizzly.ssl.SSLBaseFilter$SSLTransportFilterWrapper#2
local variable: org.glassfish.grizzly.filterchain.FilterChainContext#128
local variable: org.glassfish.grizzly.ssl.SSLConnectionContext#7889
at org.glassfish.grizzly.filterchain.ExecutorResolver$9.execute(ExecutorResolver.java:95)
at org.glassfish.grizzly.filterchain.DefaultFilterChain.executeFilter(DefaultFilterChain.java:260)
local variable: org.glassfish.grizzly.filterchain.ExecutorResolver$9#1
local variable: org.glassfish.grizzly.ssl.SSLBaseFilter$SSLTransportFilterWrapper#2
local variable: org.glassfish.grizzly.filterchain.FilterChainContext#128
at org.glassfish.grizzly.filterchain.DefaultFilterChain.executeChainPart(DefaultFilterChain.java:177)
local variable: org.glassfish.grizzly.filterchain.DefaultFilterChain#7
local variable: org.glassfish.grizzly.filterchain.FilterChainContext#128
local variable: org.glassfish.grizzly.filterchain.ExecutorResolver$9#1
local variable: org.glassfish.grizzly.filterchain.DefaultFilterChain$FiltersState#23303
local variable: org.glassfish.grizzly.ssl.SSLBaseFilter$SSLTransportFilterWrapper#2
at org.glassfish.grizzly.filterchain.DefaultFilterChain.execute(DefaultFilterChain.java:109)
local variable: org.glassfish.grizzly.filterchain.DefaultFilterChain#7
local variable: org.glassfish.grizzly.filterchain.FilterChainContext#128
local variable: org.glassfish.grizzly.filterchain.ExecutorResolver$9#1
local variable: org.glassfish.grizzly.filterchain.DefaultFilterChain$FiltersState#23303
at org.glassfish.grizzly.filterchain.DefaultFilterChain.process(DefaultFilterChain.java:88)
at org.glassfish.grizzly.ProcessorExecutor.execute(ProcessorExecutor.java:53)
local variable: org.glassfish.grizzly.filterchain.InternalContextImpl#128
at org.glassfish.grizzly.nio.transport.TCPNIOTransport.fireIOEvent(TCPNIOTransport.java:524)
at org.glassfish.grizzly.strategies.AbstractIOStrategy.fireIOEvent(AbstractIOStrategy.java:89)
local variable: org.glassfish.grizzly.nio.transport.TCPNIOConnection#8308
local variable: java.util.logging.Logger#28
at org.glassfish.grizzly.strategies.WorkerThreadIOStrategy.run0(WorkerThreadIOStrategy.java:94)
at org.glassfish.grizzly.strategies.WorkerThreadIOStrategy.access$100(WorkerThreadIOStrategy.java:33)
at org.glassfish.grizzly.strategies.WorkerThreadIOStrategy$WorkerThreadRunnable.run(WorkerThreadIOStrategy.java:114)
at org.glassfish.grizzly.threadpool.AbstractThreadPool$Worker.doWork(AbstractThreadPool.java:569)
local variable: org.glassfish.grizzly.threadpool.SyncThreadPool$SyncThreadWorker#4
local variable: org.glassfish.grizzly.threadpool.DefaultWorkerThread#9
local variable: org.glassfish.grizzly.strategies.WorkerThreadIOStrategy$WorkerThreadRunnable#115
at org.glassfish.grizzly.threadpool.AbstractThreadPool$Worker.run(AbstractThreadPool.java:549)
local variable: org.glassfish.grizzly.threadpool.SyncThreadPool$SyncThreadWorker#4
at java.lang.Thread.run(Thread.java:834)
local variable: org.glassfish.grizzly.threadpool.DefaultWorkerThread#9
"http-thread-pool::http-listener-2(17)" daemon prio=5 tid=639 RUNNABLE
at java.util.regex.Pattern$Branch.match(Pattern.java:4749)
local variable: java.util.regex.Pattern$Branch#26
local variable: java.util.regex.Matcher#1
local variable: java.lang.String#1067456
at java.util.regex.Pattern$Start.match(Pattern.java:3619)
local variable: java.util.regex.Pattern$Start#22
local variable: java.util.regex.Matcher#1
local variable: java.lang.String#1067456
at java.util.regex.Matcher.search(Matcher.java:1729)
local variable: java.util.regex.Matcher#1
at java.util.regex.Matcher.find(Matcher.java:746)
at java.util.regex.Pattern.split(Pattern.java:1264)
local variable: java.lang.String#1067456
local variable: java.util.ArrayList#596756
local variable: java.util.regex.Matcher#1
at java.util.regex.Pattern.split(Pattern.java:1334)
at sun.security.util.AlgorithmDecomposer.decomposeImpl(AlgorithmDecomposer.java:60)
local variable: java.util.HashSet#16675
local variable: java.lang.String[]#32201
at sun.security.util.AlgorithmDecomposer.decompose(AlgorithmDecomposer.java:87)
at sun.security.ssl.SSLAlgorithmDecomposer.decomposes(SSLAlgorithmDecomposer.java:142)
local variable: sun.security.ssl.SSLCipher#2
local variable: java.util.HashSet#16674
local variable: java.util.HashSet#16674
at sun.security.ssl.SSLAlgorithmDecomposer.decompose(SSLAlgorithmDecomposer.java:245)
local variable: sun.security.ssl.SSLAlgorithmDecomposer#2
local variable: sun.security.ssl.SSLCipher#2
local variable: sun.security.ssl.CipherSuite$MacAlg#2
local variable: sun.security.ssl.CipherSuite$HashAlg#2
local variable: java.util.HashSet#16672
local variable: java.util.HashSet#16672
at sun.security.ssl.SSLAlgorithmDecomposer.decompose(SSLAlgorithmDecomposer.java:271)
at sun.security.util.AbstractAlgorithmConstraints.checkAlgorithm(AbstractAlgorithmConstraints.java:95)
local variable: java.lang.String#144366
local variable: sun.security.ssl.SSLAlgorithmDecomposer#2
local variable: java.lang.String[]#637
local variable: java.lang.String#146735
at sun.security.util.DisabledAlgorithmConstraints.permits(DisabledAlgorithmConstraints.java:110)
local variable: sun.security.util.DisabledAlgorithmConstraints#2
local variable: java.lang.String#144366
at sun.security.ssl.SSLAlgorithmConstraints.permits(SSLAlgorithmConstraints.java:159)
local variable: sun.security.ssl.SSLAlgorithmConstraints#714
local variable: java.util.RegularEnumSet#19930
local variable: java.lang.String#144366
at sun.security.ssl.HandshakeContext.isActivatable(HandshakeContext.java:514)
local variable: sun.security.ssl.CipherSuite#4
local variable: sun.security.ssl.SSLAlgorithmConstraints#714
local variable: java.util.EnumMap#123
at sun.security.ssl.HandshakeContext.getActiveCipherSuites(HandshakeContext.java:338)
local variable: java.util.Collections$UnmodifiableRandomAccessList#31133
local variable: sun.security.ssl.SSLAlgorithmConstraints#714
local variable: java.util.LinkedList#89983
local variable: java.util.EnumMap#123
local variable: java.util.Collections$UnmodifiableCollection$1#2
local variable: sun.security.ssl.CipherSuite#4
at sun.security.ssl.HandshakeContext.<init>(HandshakeContext.java:184)
local variable: sun.security.ssl.ServerHandshakeContext#712
local variable: sun.security.ssl.TransportContext#8228
local variable: sun.security.ssl.ServerHandshakeContext#712
at sun.security.ssl.ServerHandshakeContext.<init>(ServerHandshakeContext.java:62)
local variable: sun.security.ssl.ServerHandshakeContext#712
at sun.security.ssl.TransportContext.kickstart(TransportContext.java:223)
local variable: sun.security.ssl.TransportContext#8228
local variable: sun.security.ssl.TransportContext#8228
local variable: sun.security.ssl.ServerHandshakeContext#712
at sun.security.ssl.SSLEngineImpl.beginHandshake(SSLEngineImpl.java:103)
local variable: sun.security.ssl.SSLEngineImpl#8224
at org.glassfish.grizzly.ssl.SSLBaseFilter$SSLTransportFilterWrapper.handleRead(SSLBaseFilter.java:1117)
local variable: org.glassfish.grizzly.ssl.SSLBaseFilter$SSLTransportFilterWrapper#2
local variable: org.glassfish.grizzly.filterchain.FilterChainContext#196
local variable: org.glassfish.grizzly.nio.transport.TCPNIOConnection#7955
local variable: org.glassfish.grizzly.ssl.SSLConnectionContext#8223
local variable: sun.security.ssl.SSLEngineImpl#8224
at org.glassfish.grizzly.filterchain.ExecutorResolver$9.execute(ExecutorResolver.java:95)
at org.glassfish.grizzly.filterchain.DefaultFilterChain.executeFilter(DefaultFilterChain.java:260)
local variable: org.glassfish.grizzly.filterchain.ExecutorResolver$9#1
local variable: org.glassfish.grizzly.ssl.SSLBaseFilter$SSLTransportFilterWrapper#2
local variable: org.glassfish.grizzly.filterchain.FilterChainContext#196
at org.glassfish.grizzly.filterchain.DefaultFilterChain.executeChainPart(DefaultFilterChain.java:177)
local variable: org.glassfish.grizzly.filterchain.DefaultFilterChain#7
local variable: org.glassfish.grizzly.filterchain.FilterChainContext#196
local variable: org.glassfish.grizzly.filterchain.ExecutorResolver$9#1
local variable: org.glassfish.grizzly.filterchain.DefaultFilterChain$FiltersState#22943
local variable: org.glassfish.grizzly.ssl.SSLBaseFilter$SSLTransportFilterWrapper#2
at org.glassfish.grizzly.filterchain.DefaultFilterChain.execute(DefaultFilterChain.java:109)
local variable: org.glassfish.grizzly.filterchain.DefaultFilterChain#7
local variable: org.glassfish.grizzly.filterchain.FilterChainContext#196
local variable: org.glassfish.grizzly.filterchain.ExecutorResolver$9#1
local variable: org.glassfish.grizzly.filterchain.DefaultFilterChain$FiltersState#22943
at org.glassfish.grizzly.filterchain.DefaultFilterChain.process(DefaultFilterChain.java:88)
at org.glassfish.grizzly.ProcessorExecutor.execute(ProcessorExecutor.java:53)
local variable: org.glassfish.grizzly.filterchain.InternalContextImpl#196
at org.glassfish.grizzly.nio.transport.TCPNIOTransport.fireIOEvent(TCPNIOTransport.java:524)
at org.glassfish.grizzly.strategies.AbstractIOStrategy.fireIOEvent(AbstractIOStrategy.java:89)
local variable: org.glassfish.grizzly.nio.transport.TCPNIOConnection#7955
local variable: java.util.logging.Logger#28
at org.glassfish.grizzly.strategies.WorkerThreadIOStrategy.run0(WorkerThreadIOStrategy.java:94)
at org.glassfish.grizzly.strategies.WorkerThreadIOStrategy.access$100(WorkerThreadIOStrategy.java:33)
at org.glassfish.grizzly.strategies.WorkerThreadIOStrategy$WorkerThreadRunnable.run(WorkerThreadIOStrategy.java:114)
at org.glassfish.grizzly.threadpool.AbstractThreadPool$Worker.doWork(AbstractThreadPool.java:569)
local variable: org.glassfish.grizzly.threadpool.SyncThreadPool$SyncThreadWorker#27
local variable: org.glassfish.grizzly.threadpool.DefaultWorkerThread#35
local variable: org.glassfish.grizzly.strategies.WorkerThreadIOStrategy$WorkerThreadRunnable#20
at org.glassfish.grizzly.threadpool.AbstractThreadPool$Worker.run(AbstractThreadPool.java:549)
local variable: org.glassfish.grizzly.threadpool.SyncThreadPool$SyncThreadWorker#27
Christoph John
a leak that looks a little like the one you observed:
https://github.com/eclipse-ee4j/glassfish/issues/22539
https://github.com/eclipse-ee4j/grizzly/pull/2015
https://github.com/eclipse-ee4j/glassfish/pull/23003
Looks like it will not be resolved before Payara 6, so disabling HTTP/2 seems to be the only option.
Cheers,
Chris.
Ryan de Laplante

Steve Millidge
Ryan de Laplante (Personal)
Thanks for the recommendation of the Eclipse Memory Analyzer. I will give that a try and get back to you tomorrow (today is a holiday in Canada)
Thanks,
Ryan
--
You received this message because you are subscribed to a topic in the Google Groups "Payara Forum" group.
To unsubscribe from this topic, visit https://groups.google.com/d/topic/payara-forum/KTgFuW1zsg4/unsubscribe.
To unsubscribe from this group and all its topics, send an email to payara-forum...@googlegroups.com.
To view this discussion on the web, visit https://groups.google.com/d/msgid/payara-forum/3f89a173-c7a3-4472-99a8-7c1a491234fan%40googlegroups.com.
Steve Millidge
Ryan de Laplante
One instance of java.util.WeakHashMap loaded by <system class loader> occupies 1,788,579,160 (83.96%) bytes. The instance is referenced by org.glassfish.grizzly.threadpool.DefaultWorkerThread @ 0x82e86c28 http-thread-pool::http-listener-2(1) , loaded by org.apache.felix.framework.BundleWiringImpl$BundleClassLoader @ 0x82368338.
The thread org.glassfish.grizzly.threadpool.DefaultWorkerThread @ 0x82e86c28 http-thread-pool::http-listener-2(1) keeps local variables with total size 246,592 (0.01%) bytes.
The memory is accumulated in one instance of java.util.TreeMap$Entry, loaded by <system class loader>, which occupies 1,786,697,736 (83.87%) bytes.