Branch-site output analysis - ranking selection

FloraWF
Nei & Gojobori 1986. dN/dS (dN, dS)
(Note: This matrix is not used in later ML. analysis.
Use runmode = -2 for ML pairwise comparison.)
mB_mM_rna-XM_036355946.1
mL_mM_rna-XM_036355946.1 0.8780 (0.1207 0.1374)
molMol_rna-XM_036265664.1 0.4039 (0.1470 0.3639) 0.2335 (0.0470 0.2014)
myoMyo_rna-XM_036355946.1 0.6852 (0.1207 0.1761)-1.0000 (0.0000 0.0653) 0.1767 (0.0470 0.2661)
phyDis_rna-XM_028511718.2 0.2865 (0.1425 0.4974) 0.0567 (0.0188 0.3312) 0.1649 (0.0564 0.3421) 0.0528 (0.0188 0.3561)
pipKuh_rna-XM_036461239.1 0.4138 (0.1262 0.3051) 0.0300 (0.0047 0.1556) 0.1804 (0.0520 0.2883) 0.0197 (0.0047 0.2366) 0.0478 (0.0236 0.4933)
rhiFer_rna-XM_033129987.1 0.3659 (0.1597 0.4364) 0.1806 (0.0430 0.2382) 0.2270 (0.0797 0.3511) 0.1522 (0.0430 0.2826) 0.1679 (0.0478 0.2850) 0.1265 (0.0480 0.3792)
rouAeg_rna-XM_016158917.2 0.3950 (0.1642 0.4158) 0.1510 (0.0471 0.3116) 0.0637 (0.0283 0.4436) 0.1216 (0.0471 0.3869) 0.1472 (0.0465 0.3163) 0.1042 (0.0520 0.4993) 0.3469 (0.0772 0.2226)
TREE # 1: (8, 7, (5, (3, (6, (4, (1, 2)))))); MP score: 91
lnL(ntime: 13 np: 18): -855.129416 +0.000000
9..8 9..7 9..10 10..5 10..11 11..3 11..12 12..6 12..13 13..4 13..14 14..1 14..2
0.188874 0.177214 0.049931 0.120809 0.052055 0.213671 0.088608 0.118041 0.000004 0.044529 0.000004 1.692902 0.000004 4.502588 0.721997 0.127971 0.026264 67.818936
Note: Branch length is defined as number of nucleotide substitutions per codon (not per neucleotide site).
tree length = 2.74665
(8: 0.188874, 7: 0.177214, (5: 0.120809, (3: 0.213671, (6: 0.118041, (4: 0.044529, (1: 1.692902, 2: 0.000004): 0.000004): 0.000004): 0.088608): 0.052055): 0.049931);
(rouAeg_rna-XM_016158917.2: 0.188874, rhiFer_rna-XM_033129987.1: 0.177214, (phyDis_rna-XM_028511718.2: 0.120809, (molMol_rna-XM_036265664.1: 0.213671, (pipKuh_rna-XM_036461239.1: 0.118041, (myoMyo_rna-XM_036355946.1: 0.044529, (mB_mM_rna-XM_036355946.1: 1.692902, mL_mM_rna-XM_036355946.1: 0.000004): 0.000004): 0.000004): 0.088608): 0.052055): 0.049931);
Detailed output identifying parameters
kappa (ts/tv) = 4.50259
MLEs of dN/dS (w) for site classes (K=4)
site class 0 1 2a 2b
proportion 0.72200 0.12797 0.12744 0.02259
background w 0.02626 1.00000 0.02626 1.00000
foreground w 0.02626 1.00000 67.81894 67.81894
Naive Empirical Bayes (NEB) analysis (please use the BEB results.)
Positive sites for foreground lineages Prob(w>1):
1 G 0.999**
2 Q 0.999**
3 S 0.998**
5 A 0.670
7 T 0.851
8 M 0.724
10 S 0.627
11 G 0.999**
12 T 0.991**
13 A 1.000**
15 T 0.982*
16 Q 0.999**
19 P 1.000**
20 G 0.997**
Bayes Empirical Bayes (BEB) analysis (Yang, Wong & Nielsen 2005. Mol. Biol. Evol. 22:1107-1118)
Positive sites for foreground lineages Prob(w>1):
1 G 0.999**
2 Q 0.998**
3 S 0.999**
5 A 0.869
6 I 0.694
7 T 0.585
8 M 0.894
10 S 0.838
11 G 0.997**
12 T 0.997**
13 A 0.998**
15 T 0.950
16 Q 0.996**
19 P 1.000**
20 G 0.991**
The grid (see ternary graph for p0-p1)
w0: 0.050 0.150 0.250 0.350 0.450 0.550 0.650 0.750 0.850 0.950
w2: 1.500 2.500 3.500 4.500 5.500 6.500 7.500 8.500 9.500 10.500
Posterior on the grid
w0: 0.999 0.001 0.000 0.000 0.000 0.000 0.000 0.000 0.000 0.000
w2: 0.000 0.000 0.000 0.001 0.005 0.018 0.052 0.126 0.270 0.528
Posterior for p0-p1 (see the ternary graph) (YWN2015, fig. 1)
0.000
0.000 0.000 0.000
0.000 0.000 0.000 0.000 0.000
0.000 0.000 0.000 0.000 0.000 0.000 0.000
0.000 0.000 0.000 0.000 0.000 0.000 0.000 0.000 0.000
0.000 0.000 0.000 0.000 0.000 0.000 0.000 0.000 0.000 0.000 0.000
0.000 0.000 0.000 0.000 0.000 0.000 0.000 0.000 0.000 0.000 0.000 0.000 0.000
0.000 0.000 0.000 0.000 0.000 0.000 0.000 0.000 0.000 0.000 0.002 0.000 0.002 0.000 0.000
0.000 0.000 0.000 0.000 0.000 0.000 0.000 0.000 0.001 0.001 0.030 0.038 0.228 0.072 0.072 0.000 0.000
0.000 0.000 0.000 0.000 0.000 0.000 0.000 0.000 0.000 0.002 0.002 0.050 0.021 0.285 0.044 0.145 0.005 0.000 0.000
sum of density on p0-p1 = 1.000000
Time used: 0:23

Sandra AC
The information about estimated ω can be found here:
MLEs of dN/dS (w) for site classes (K=4)
site class 0 1 2a 2b
proportion 0.72200 0.12797 0.12744 0.02259
background w 0.02626 1.00000 0.02626 1.00000
foreground w 0.02626 1.00000 67.81894 67.81894
This information can be summarised as follows (hope I have not mistyped some values!):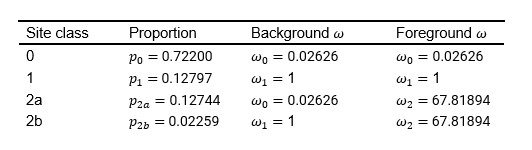
Remember that:
- First row in the table above: sites assigned to site class 0 (estimated proportion of sites in site class 0 is ~72%, second column in table above) will be under purifying selection along all branches with 0 < ω0 < 1; both background and foreground branches (third and fourth column in table above).
- Second row in the table above: sites assigned to site class 1 (estimated proportion of sites in site class 1 is ~13% , second column in table above) are undergoing neutral evolution with ω1 = 1 (always fixed for both background and foreground branches, third and fourth column in table above).
- Third and fourth row in the table above: In site classes 2a (estimated proportion of sites is in site class 2a is ~13% , second column in table above ) and 2b (estimated proportion of sites in site class 2b is ~3% , second column in table above ), there is positive selection along foreground branches with ω2 >1, while background branches are under purifying selection with 0 < ω0 < 1 or undergoing neutral evolution with ω1 = 1. You can see the estimated omega values for both background and foreground branches for sites under each class in the table above and how they differ. According to your results, the estimated ω for the foreground branch that you have labelled in your tree suggests that the sites along this branch are under positive selection. Your BEB analysis (ignore the NEB as it is not replaced by the BEB) shows 9 sites with a probability larger than 99% to be positively selected.
All the best,