Skip to first unread message

Tejaswini Pedapati
Aug 27, 2015, 10:30:48 AM8/27/15
to OrientDB
Hi all,
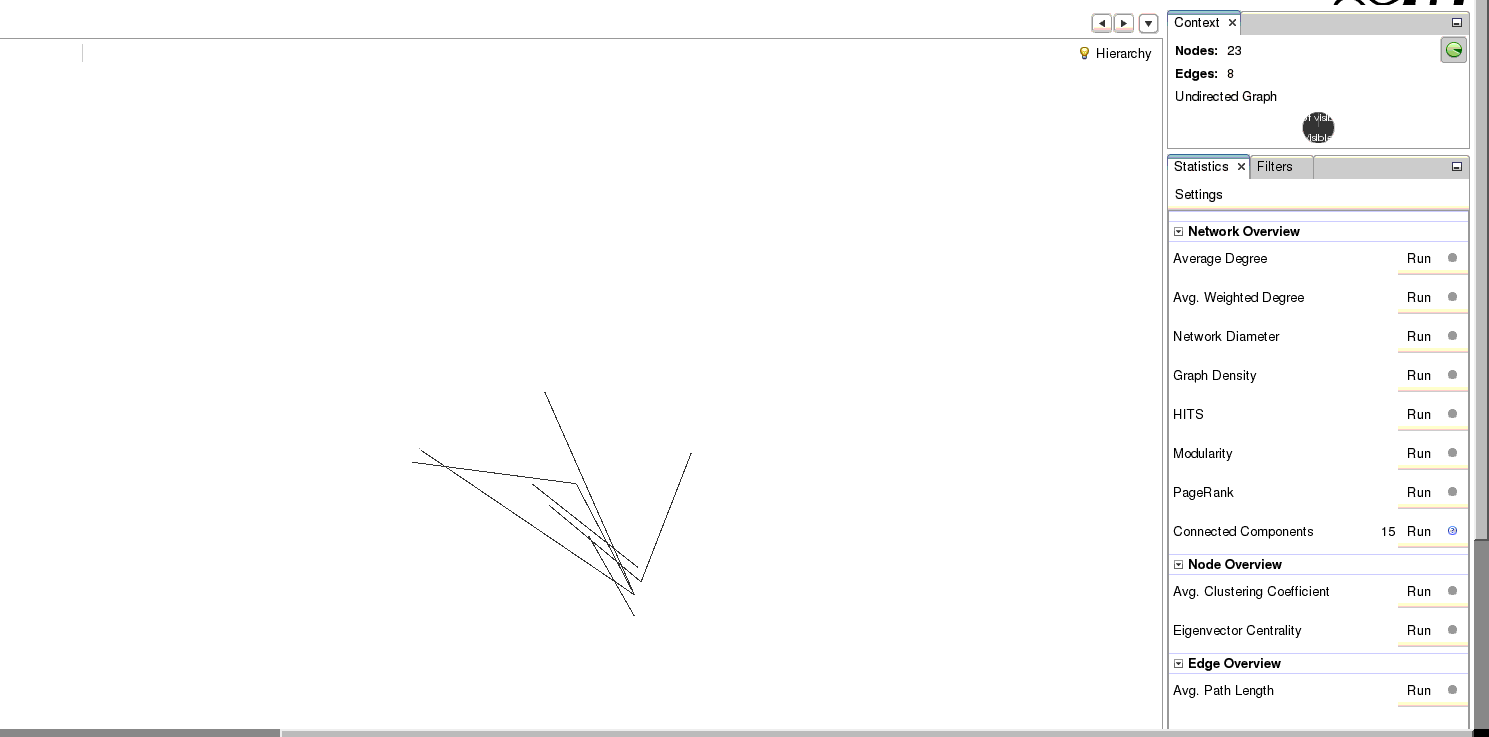
I am a newbie. I have stored my data in orientdb as a graph db. I would like to embed a graph similar to that displayed in orientdb's studio on my website. Currently as orientdb's studio does not have any API, http://stackoverflow.com/questions/21893401/interactive-and-dynamic-graph-visualization this link suggested gephi as one of the graph visualization tools. I was able to use gephi's streaming and generate a graph. However, the graph displayed in gephi comprises only of edges and is nowhere close to that generated by orientdb's studio. Am I missing something? Also how I save this graph? There does not seem to be a way to save this graph.
Thanks
Tejaswini
Reply all
Reply to author
Forward
0 new messages