Vehicle utilisation.
103 views
Skip to first unread message

Param
Sep 23, 2021, 2:03:21 AM9/23/21
to or-tools-discuss
I am trying to learn OR tools and I came across a problem. I have specified 2 vehicles but only 1 vehicle is used. The use of counter dimension has no effect. Below is the code.
```python
import numpy as np
import ortools
from ortools.constraint_solver import pywrapcp, routing_enums_pb2
import matplotlib.pyplot as plt
def extract_solution(transformed_data, manager, routing, solution, time_dimension):
solution_list = [[] for _ in range(transformed_data['num_vehicles'])] # Storage for solution.
time_list = [[] for _ in range(transformed_data['num_vehicles'])] # Storage for time.
for vehicle in range(transformed_data['num_vehicles']): # Iterating over all the vehicles.
index = routing.Start(vehicle) # Starting index of a specific vehicle.
while not routing.IsEnd(index): # Running the loop till the index is not last.
solution_list[vehicle].append(manager.IndexToNode(index)) # Appending the node of a specific vehicle.
time_var = time_dimension.CumulVar(index)
time_list[vehicle].append((solution.Min(time_var), # Appending the time required.
solution.Max(time_var)))
index = solution.Value(routing.NextVar(index)) # Assigning the next index.
# Including the last node values.
solution_list[vehicle].append(manager.IndexToNode(index))
time_var = time_dimension.CumulVar(index)
time_list[vehicle].append((solution.Min(time_var), solution.Max(time_var)))
return solution_list, time_list
def create_data_model():
data = {}
data['coordinates'] = {0: (5, 5),
1: (5, 10),
2: (10, 10),
3: (10, 5),
4: (5, 0),
5: (0, 0),
6: (0, 5)}
data['time_matrix'] = [[int(abs(np.linalg.norm(np.array(v) - np.array(v_)))) for k, v_ in data['coordinates'].items()] for k, v in data['coordinates'].items()]
data['num_vehicles'] = 2
data['demands'] = [0, 4, 4, 2, 4, 2, 4, 8]
data['vehicle_capacities'] = [15 for _ in range(data['num_vehicles'])]
data['depot'] = 0
return data
def main():
data = create_data_model()
manager = pywrapcp.RoutingIndexManager(len(data['time_matrix']),
data['num_vehicles'], data['depot'])
routing = pywrapcp.RoutingModel(manager)
# Time callback
def time_callback(from_index, to_index):
from_node = manager.IndexToNode(from_index)
to_node = manager.IndexToNode(to_index)
return data['time_matrix'][from_node][to_node]
transit_callback_index = routing.RegisterTransitCallback(time_callback)
routing.SetArcCostEvaluatorOfAllVehicles(transit_callback_index)
time = 'Time'
routing.AddDimension(
transit_callback_index,
300, # allow waiting time
300, # maximum time per vehicle
False, # Don't force start cumul to zero.
time)
time_dimension = routing.GetDimensionOrDie(time)
time_dimension.SetGlobalSpanCostCoefficient(100)
# Add Capacity constraint.
def demand_callback(from_index):
from_node = manager.IndexToNode(from_index)
return data['demands'][from_node]
demand_callback_index = routing.RegisterUnaryTransitCallback(demand_callback)
routing.AddDimensionWithVehicleCapacity(
demand_callback_index,
0, # null capacity slack
data['vehicle_capacities'], # vehicle maximum capacities
True, # start cumul to zero
'Capacity')
# Setting first solution heuristic.
search_parameters = pywrapcp.DefaultRoutingSearchParameters()
search_parameters.first_solution_strategy = (routing_enums_pb2.FirstSolutionStrategy.PATH_CHEAPEST_ARC)
search_parameters.local_search_metaheuristic = (routing_enums_pb2.LocalSearchMetaheuristic.GUIDED_LOCAL_SEARCH)
search_parameters.time_limit.seconds = 10
# Solve the problem.
solution = routing.SolveWithParameters(search_parameters)
solution_list, time_list = extract_solution(data, manager,
routing, solution, time_dimension)
total_time = sum([t[-1][1] for t in time_list if len(t) > 0])
# Printing
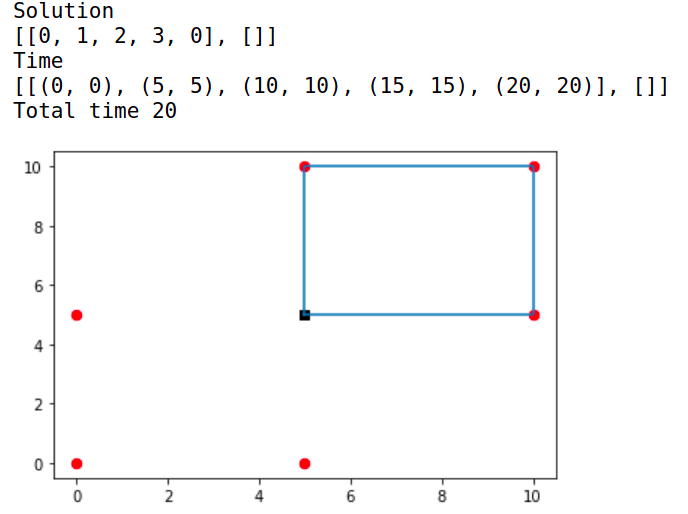
print('Solution')
print(solution_list)
print('Time')
print(time_list)
print('Total time', total_time)
# Plotter.
x, y = list(zip(*list(data['coordinates'].values())[1:]))
plt.scatter(data['coordinates'][0][0], data['coordinates'][0][1],
marker = 's', s = 40, color = 'k')
plt.scatter(x, y,
marker = 'o', s = 40, color = 'r')
for sol in solution_list:
if len(sol) > 2:
xs, ys = list(zip(*[data['coordinates'].get(k) for k in sol]))
plt.plot(xs, ys)
plt.show()
if __name__ == '__main__':
main()
```
The result I am getting is like this
As you can see only one vehicle is utilised. Why is that so? According to me it should have used the other vehicle as well.

Mizux Seiha
Sep 23, 2021, 3:43:13 AM9/23/21
to or-tools-discuss
In `def extract_solution(transformed_data, manager, routing, solution, time_dimension):`
Your return should NOT be part of the for loop -> `return solution_list, time_list` should be de-indented...
Mizux Seiha
Sep 23, 2021, 3:49:07 AM9/23/21
to or-tools-discuss
Same for your display plt.show() should be outside I.e. in your loop draw each route one by one THEN display the whole graph...
```py
```py
for sol in solution_list:
if len(sol) > 2:
xs, ys = list(zip(*[data['coordinates'].get(k) for k in sol]))
plt.plot(xs, ys)
plt.show()
```
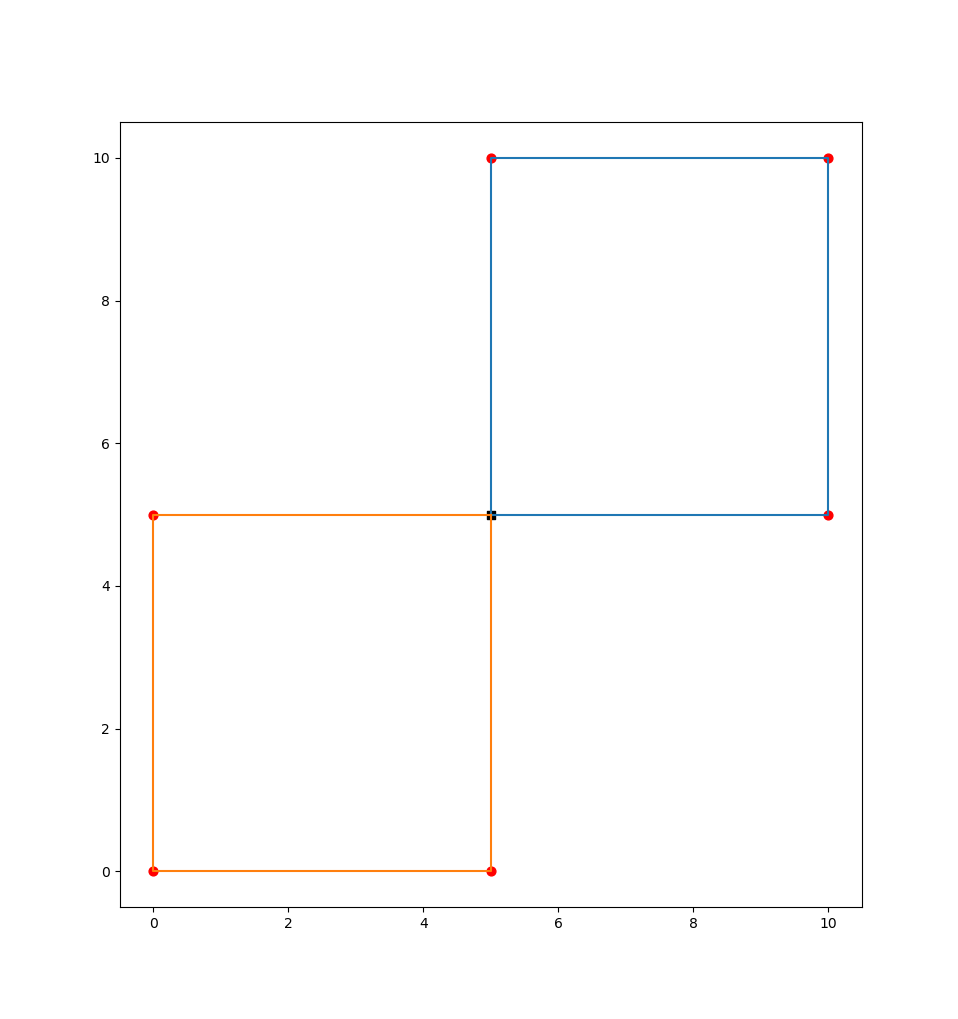
Mizux Seiha
Sep 23, 2021, 3:50:56 AM9/23/21
to or-tools-discuss
Solution
[[0, 1, 2, 3, 0], [0, 4, 5, 6, 0]]
Time
[[(0, 0), (5, 5), (10, 10), (15, 15), (20, 20)], [(0, 0), (5, 5), (10, 10), (15, 15), (20, 20)]]
Total time 40
Param
Sep 23, 2021, 6:12:35 AM9/23/21
to or-tools-discuss
Thank you Mr. Mizu.
Reply all
Reply to author
Forward
0 new messages