Plot VRP output
805 views
Skip to first unread message

uni_r
May 22, 2021, 2:08:36 PM5/22/21
to or-tools-discuss
Hello, I would like to make the same graph as on this page, with the various paths...I have seen some source code here in old conversations, but I haven't really understood how to use it....
Is there any quick way to plot the results of the problem??
Thank you!

Mizux Seiha
May 22, 2021, 2:22:26 PM5/22/21
to or-tools-discuss
It is generated by a quick and dirty script you can find here: https://github.com/google/or-tools/blob/stable/ortools/constraint_solver/doc/routing_svg.py
usage: https://github.com/google/or-tools/blob/stable/ortools/constraint_solver/doc/generate_svg.sh
usage: https://github.com/google/or-tools/blob/stable/ortools/constraint_solver/doc/generate_svg.sh
uni_r
May 22, 2021, 5:14:49 PM5/22/21
to or-tools-discuss
Hi, i opened the first link but i didn't understand how should i use this... I have also seen that the model is defined differently to the scripts on Or-Tools, like this one for example:
Vehicle Routing with Pickups and Deliveries | OR-Tools (google.com) (Python)
Is there any way (even if it is not necessarily the graph of or tool) to graph solutions in a simple way?

Priidik Vilumaa
May 23, 2021, 4:18:06 AM5/23/21
to or-tools...@googlegroups.com
Similar question popped up about visualization some time ago:
Perhaps you can find some other conversations in the mailing list as well. I don't think you necessarily need a .svg output anyway
Best,
Priidik
--
You received this message because you are subscribed to the Google Groups "or-tools-discuss" group.
To unsubscribe from this group and stop receiving emails from it, send an email to or-tools-discu...@googlegroups.com.
To view this discussion on the web visit https://groups.google.com/d/msgid/or-tools-discuss/976dcc1a-fe04-4c3e-92c0-b11f00fd4713n%40googlegroups.com.
uni_r
May 23, 2021, 6:30:31 AM5/23/21
to or-tools-discuss
Hello, I have opened the page you linked, could you explain to me how to implement point 1, starting from the solution I have? I'm sorry but i'm quite new with Python...
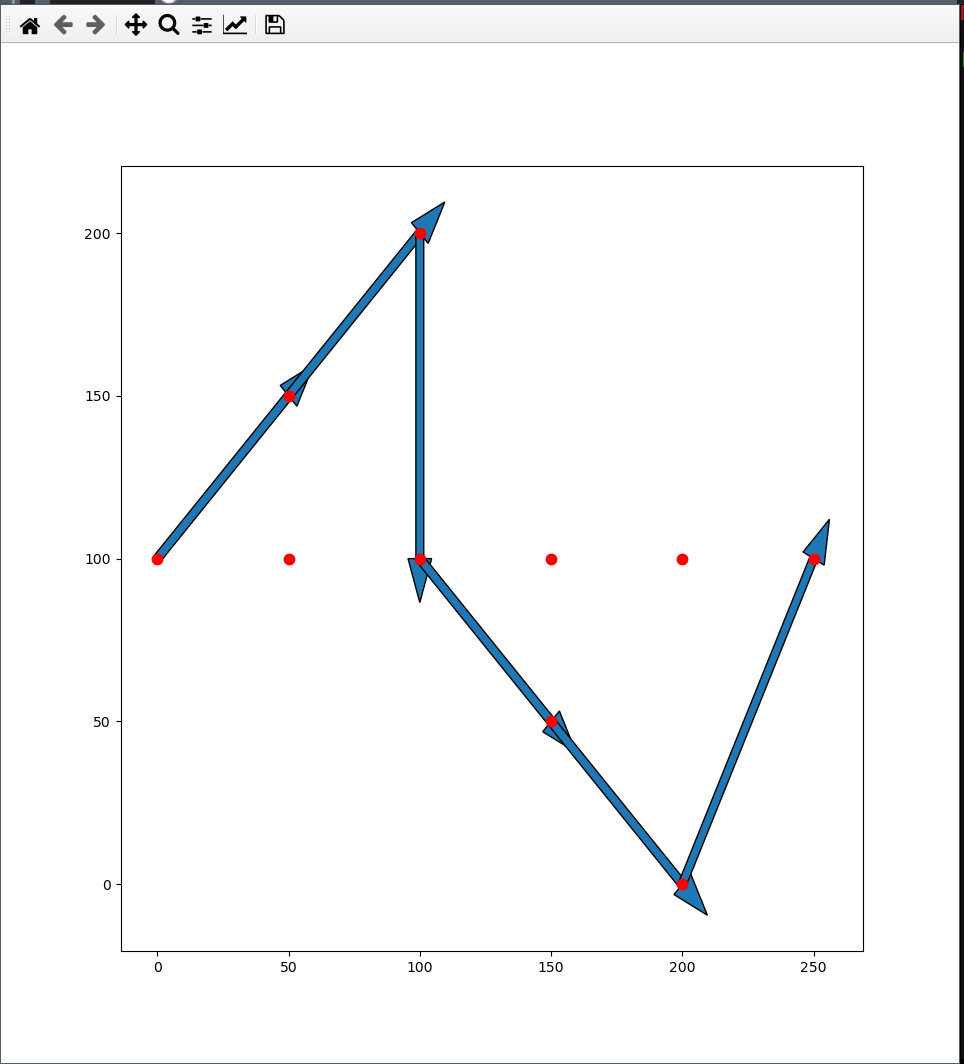
Point 1 is this: "If you are visualizing just for the sake of debugging, then plot the points/lines with matplotlib on a white canvas. It's very fast/simple and will give you enough information"
Thank you!
Mizux Seiha
May 23, 2021, 6:50:12 AM5/23/21
to or-tools-discuss
here an ugly gist (I'll try to cleanup ASAP)
The main issue, is technically the solver don't know/care of the representation.
i.e. the routing solver only need transit Matrix (cost, distance, time) or Vector (capacity). but don't know the 2D (or 1D or 3D ?) locations of each node.
so to "DISPLAY" you must have this information somehow.
Then yes maybe mathplotlib is the easiest way to have a quick and dirty figure.
ps: I've use a custom svg rendering since I wanted to have an adhoc rendering, (google color palette, display custom grid, time range text, fuel icons, refill station icons, and with maybe animation (svg do have animation spec :D)

Corentin "mizux" Le Molgat
May 23, 2021, 7:47:25 AM5/23/21
to or-tools-discuss
Just updated the gist using the VRP GlobalSpan sample...
Reply all
Reply to author
Forward
0 new messages