Post-processing request
224 views
Skip to first unread message

Patrick Hammer
Aug 10, 2022, 10:31:31 AM8/10/22
to ope...@googlegroups.com
Good morning,
I was wondering if it would be possible to do two things in OpenVSP that would beneficial. I'd like to compare OpenVSP to some CFD, and one of the items of interest would be the surface pressure. The post-processing I do for the CFD is done using Fieldview (now owned by TecPlot). It'd be very helpful if both the colormaps I use for fieldview could be loaded into the OpenVSP module, as well as their view files, so I can make surface contours images in the same view. I understand if that's not possible or would be too involved, but I at least wanted to throw it out there as something that could be a useful improvement.
Patrick

Rob McDonald
Aug 26, 2022, 1:18:19 AM8/26/22
to OpenVSP
I understand the suggestion.
The plotting tools in OpenVSP (particularly the Results manager for various line plots) are not meant to be used for publication or archival quality plots. Instead, they are meant to serve as a tool for an instant sanity check.
My experience is that if plotting things isn't easy, then people don't do it.
Many things in an aero code need supervision / sanity checks -- so to try to encourage users to look at convergence histories, load distributions, pressure distributions, etc -- we made the Results manager produce these plots, pop them up automatically, and force the user to look at them. No excuses.
That said, we can't compete with TecPlot or many other high quality plotting programs with nearly infinite options for formatting charts just so and importing arbitrary data, etc. We don't even want to try. Consequently, we don't intend the built-in 2D line graph plotter to be used for 'real' plots -- they're just for in-progress sanity checking.
The VSPAERO viewer (where you can visualize the Cp distribution, wake lines, etc) is a bit more of a grey area. It is also meant for quick flow diagnostics, but the data it works from is stored in the binary *.adb file. Consequently, there is no easy way to get that data to 3rd party plotting programs (like TecPlot).
Unfortunately, it isn't just a trivial matter of dumping out a TecPlot file -- that works great if your data exists (in memory) in a format that is well represented by one of TecPlot's file formats. VSPAERO's *.adb file actually contains enough information to serve as a restart file for a solution. VSPAERO's internal mesh representation includes the information about the mesh agglomeration -- the process of grouping nearby groups of panels together into a larger super-panel (press + and - in the viewer while visualizing the computational mesh to see this). The mesh agglomeration levels are very similar to an unstructured multigrid. I do not know that TecPlot, FieldView, ParaView, or whatever have the ability to represent this kind of information.
I believe your suggestion was actually the other way -- make the VSPAERO viewer able to read in TecPlot (or other) files to allow them to be compared side-by-side and apples-to-apples. I think we want to avoid that for the same reasons we don't want to duplicate TecPlot in OpenVSP. There are an unlimited number of ways you might want to construct visualizations in TecPlot. We can not hope to produce a comparable tool.
Instead of writing all the data in the *.adb file to a TecPlot file, it may suffice to write a simplifed subset. For example, the Cp values on just the input triangle mesh (not the agglomerated meshes). Then you could pull both files into TecPlot and compare there.
There is a lot of other data that we have - that may or may not be easily represented. But perfect is the enemy of good, so we should probably do something...
I will think about this and bring it up to Dave.
Rob
Patrick Hammer
Aug 26, 2022, 9:48:31 AM8/26/22
to ope...@googlegroups.com
Rob,
All of that makes sense. I simply wanted to throw the idea out there just in case it's a feasible idea.
Thanks for the answers,
Patrick
--
You received this message because you are subscribed to the Google Groups "OpenVSP" group.
To unsubscribe from this group and stop receiving emails from it, send an email to openvsp+u...@googlegroups.com.
To view this discussion on the web visit https://groups.google.com/d/msgid/openvsp/b3cd2010-99a8-4415-ac1f-b24bc41d25e7n%40googlegroups.com.

Inseo Choi
Aug 26, 2022, 10:36:17 AM8/26/22
to OpenVSP
I usally make my own Post-processing code using matlab for viewing output from vspaero.
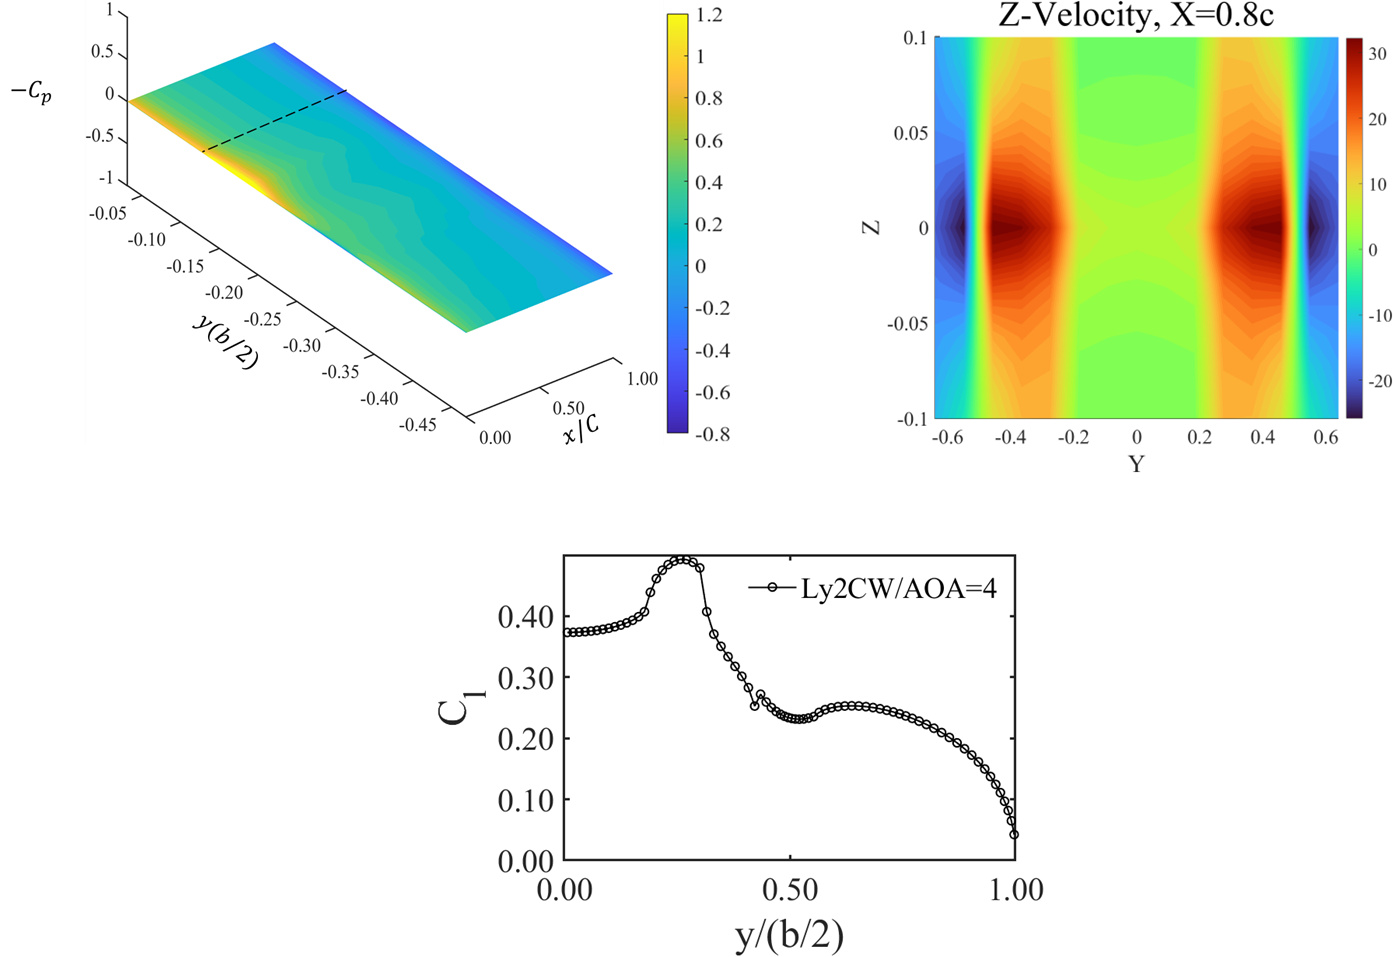
For example you can use the output file like .csv or vspaero etc.
If you want to see a cl distribution of the wing, find a list of cl distribution on csv file from vspaero save files.
But if there a nice post-processing option(not meaning the now is bad) in vspaero viewer, it will be good to make figure or database for writing the journal of paper, someting else.
This figure is the output data using matlab code.
Thank you
Inseo
2022년 8월 26일 금요일 오후 10시 48분 31초 UTC+9에 hamm...@gmail.com님이 작성:
Patrick Hammer
Aug 26, 2022, 10:44:15 AM8/26/22
to ope...@googlegroups.com
I also use Matlab for creating line plots. What I was more interested in was the flow visualization, like surface pressure and the trailing wakes.
Regarding the .abd file, what is that used for or what can that be read into?
Patrick
To view this discussion on the web visit https://groups.google.com/d/msgid/openvsp/1d61a4a2-e78b-449e-b34b-4fb5a87a2794n%40googlegroups.com.
Rob McDonald
Aug 26, 2022, 11:16:20 AM8/26/22
to ope...@googlegroups.com
The *.adb file is VSPAERO's own custom format. It stands for aero database. It contains whatever VSPAERO needs to store and/or communicate to the viewer.
In addition to being a binary file format, the VSPAERO developer reserves the right to change its contents or format at any time. So, parsing the *.adb file directly is strongly discouraged.
If you really want to parse it, I would recommend you write a parser based on the viewer's own parser (calling the same functions, using the same data structures). That way, when changes are made in the future, you can hopefully just move to the new data and parsing code. However, even with that, it is not recommended.
This is the reason that writing out a TecPlot (or other generic) file should be done by either vspaero, viewer, or another tool maintained by the VSPAERO developer.
Rob
To view this discussion on the web visit https://groups.google.com/d/msgid/openvsp/CAD%2BHx8BGqFcPOALGNqg%2BkkufLMCuV47hY7Sp8Q1dqpgXLMgbVQ%40mail.gmail.com.

flashnag
Nov 11, 2024, 10:39:49 PM11/11/24
to OpenVSP
what ascii file are the individual panel Cp values in? I thought they were only accessible in the adb file.
Nice plots !
Reply all
Reply to author
Forward
0 new messages