Irregularities in the Dynamic derivatives when wing trailing wakes hit the tail
77 visualitzacions
Ves al primer missatge no llegit

Ashley M
20 d’oct. 2022, 9:42:5420/10/22
a OpenVSP
Hi Rob, Hi all,
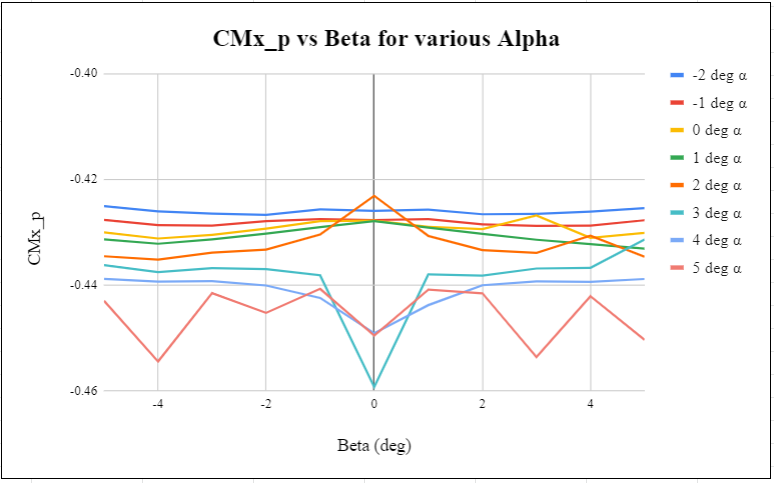
I am generating dynamic derivative data (using the VLM method) for a range of alpha and Beta. I have looked into the variation of CMx_p, CMx_r, CMz_p, and CMz_r wrt to beta (for various Alpha) and also the variation in CMy_q wrt to alpha (for various alpha). Please find some of the plots attached. (Data generated using OpenVSP V 3.30.0)
The above plot shows that the variation in CMx_p wrt to ß is fairly constant for -2, and -1 deg alpha, but for higher angles we observe irregularities.
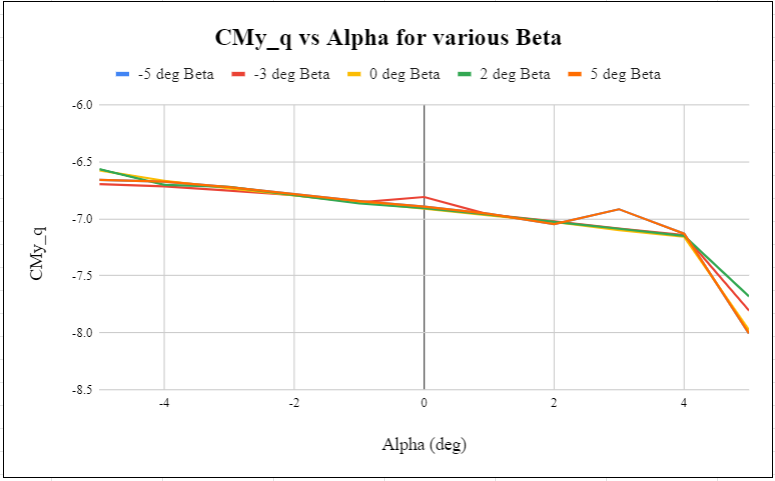
In the above plot, the -5 and +5 deg Beta plots are overlapping and show irregularities. All the plots show irregularity at 5 deg Alpha.
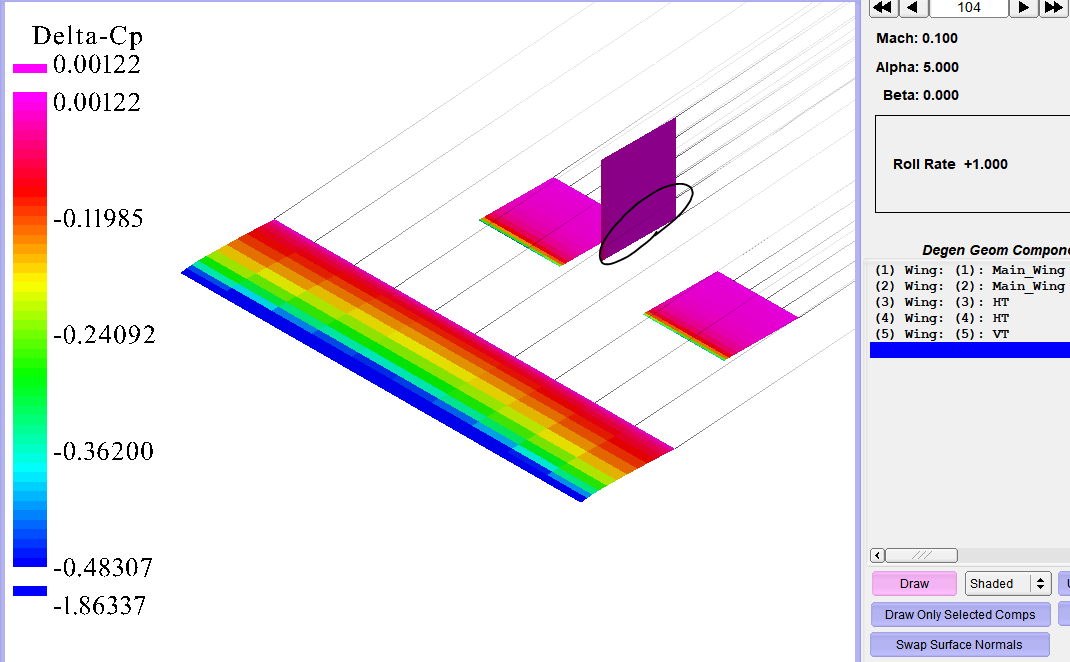
The irregularities observed in the data are prevalent across all dynamic derivatives. Digging into it further, I looked at the LOD file for component contributions and identified that the moment contribution of the tail is causing the irregularity. I suspect that the irregularities in the data arise when the trailing wake of the wing hits either the vertical or the horizontal tail. Please let me know your thoughts on this.
I used OpenVSP V3.30.0, V3.27.1, and 3.26.1 to generate data. The irregularities were also observed across the versions. I have attached the vsp3 file along with the vspaero, stab, and lod files from my run. The vsp3 file is saved with the settings used for my run.
Thank you.
Regards

Brandon Litherland
20 d’oct. 2022, 10:20:2020/10/22
a OpenVSP
it appears from your Viewer screenshot that you are using the default NumU of 6 which will be inadequate for capturing decent VSPAERO solution behavior. For a start, I would recommend adjusting the model using some best-practices presented at the 2021 OpenVSP Workshop https://openvsp.org/wiki/lib/exe/fetch.php?media=workshop21:2021_vspws_-_modeling_best-practices_for_vspaero.pdf.
Let's see if the plots continue to present these characteristics with improved clustering and tessellation. Then we can jump off from there!

Rob McDonald
20 d’oct. 2022, 11:52:0820/10/22
a ope...@googlegroups.com
I agree with Brandon that your model needs more spanwise resolution in general. However, you are doing a great job of starting with a simple case and building up from there.
I would encourage you to connect your horizontal tail surfaces together at the aircraft centerline. Every 'free' edge of a lifting surface will be a place for a tip vortex to roll up. The lift distribution on two split tails is quite different from the lift distribution on a single contiguous tail. The reality (of a tail split by a fuselage) is somewhere in-between, but most people extend the tails to the center line.
When a wake impinges on a tail surface, it is reasonable to expect some effect on the coefficients -- and the derivatives. In the real world, a wing's wake is both a layer of vorticity rollup from the creation of lift, but also a momentum deficit from the wing's boundary layer. Our panel code only predicts one of these.
I do not know of a data source that dives into this phenomena with great detail -- something that would be suitable to use for a validation test.
Most traditional CFD analysis would probably not be great at this. The off-body resolution of CFD is usually very coarse -- which would cause a lot of dissipation of things like vortices and boundary layers. When people use CFD to study things like aircraft flying in formation, they are forced to go to great lengths to resolve the wakes far downstream from the aircraft. In fact, many studies of things like formation flight, safe separation distance, bird flight, etc. are done with potential flow methods because they are much more efficient at modeling the effect of the wake far downstream.
I vaguely recall a Cart3D study of a missile -- where a tip vortex from a forward fin impinged on an aft fin (I think) and it had great effect on one of the moments. The adjoint adaptation magic of Cart3D was able to resolve this -- the final mesh was not like anything a human would have created. It looks like this paper -- but I remember more striking results...
Rob
--
You received this message because you are subscribed to the Google Groups "OpenVSP" group.
To unsubscribe from this group and stop receiving emails from it, send an email to openvsp+u...@googlegroups.com.
To view this discussion on the web visit https://groups.google.com/d/msgid/openvsp/d0b52471-4c48-41ab-a019-cffcfd6c7788n%40googlegroups.com.
Ashley M
4 de nov. 2022, 9:42:374/11/22
a OpenVSP
Hi Brandon and Rob,
Thank you very much for your input. It has been tremendously helpful.
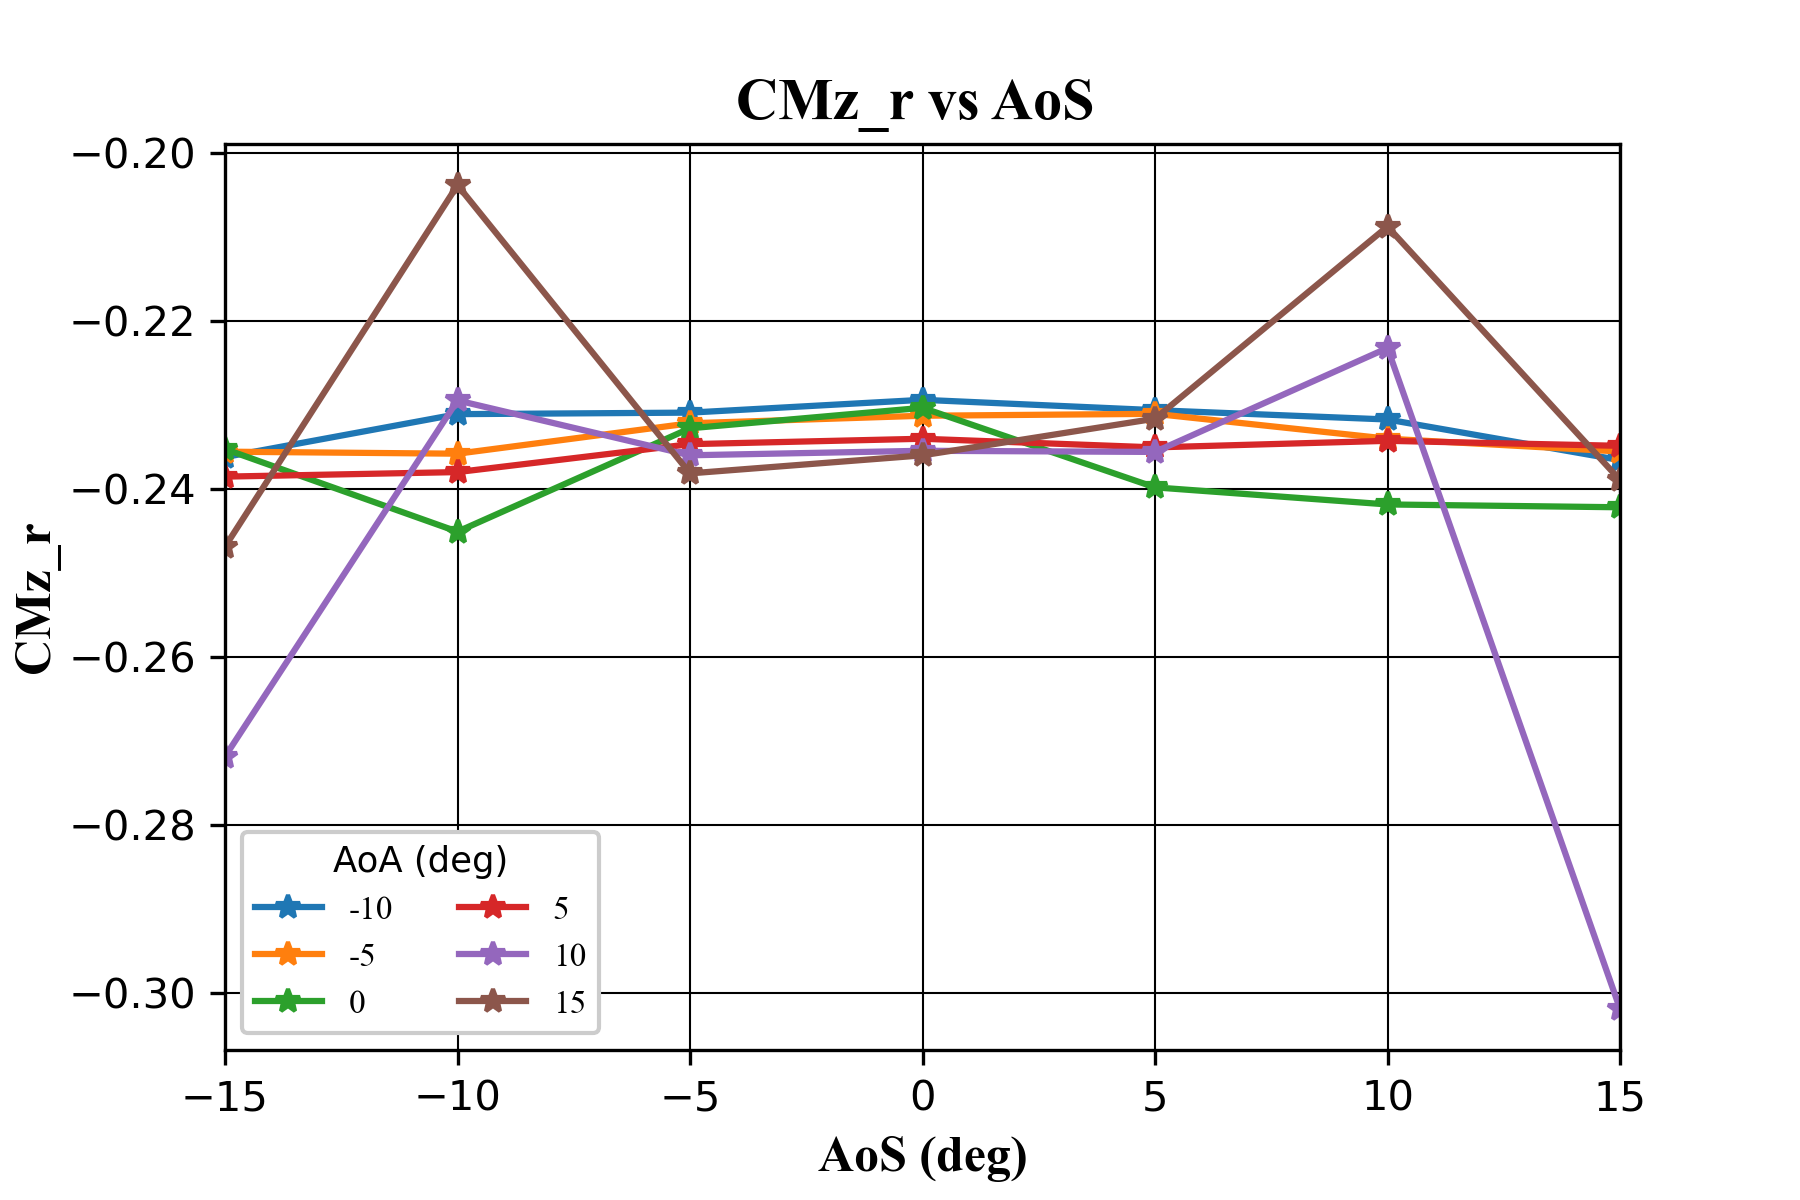
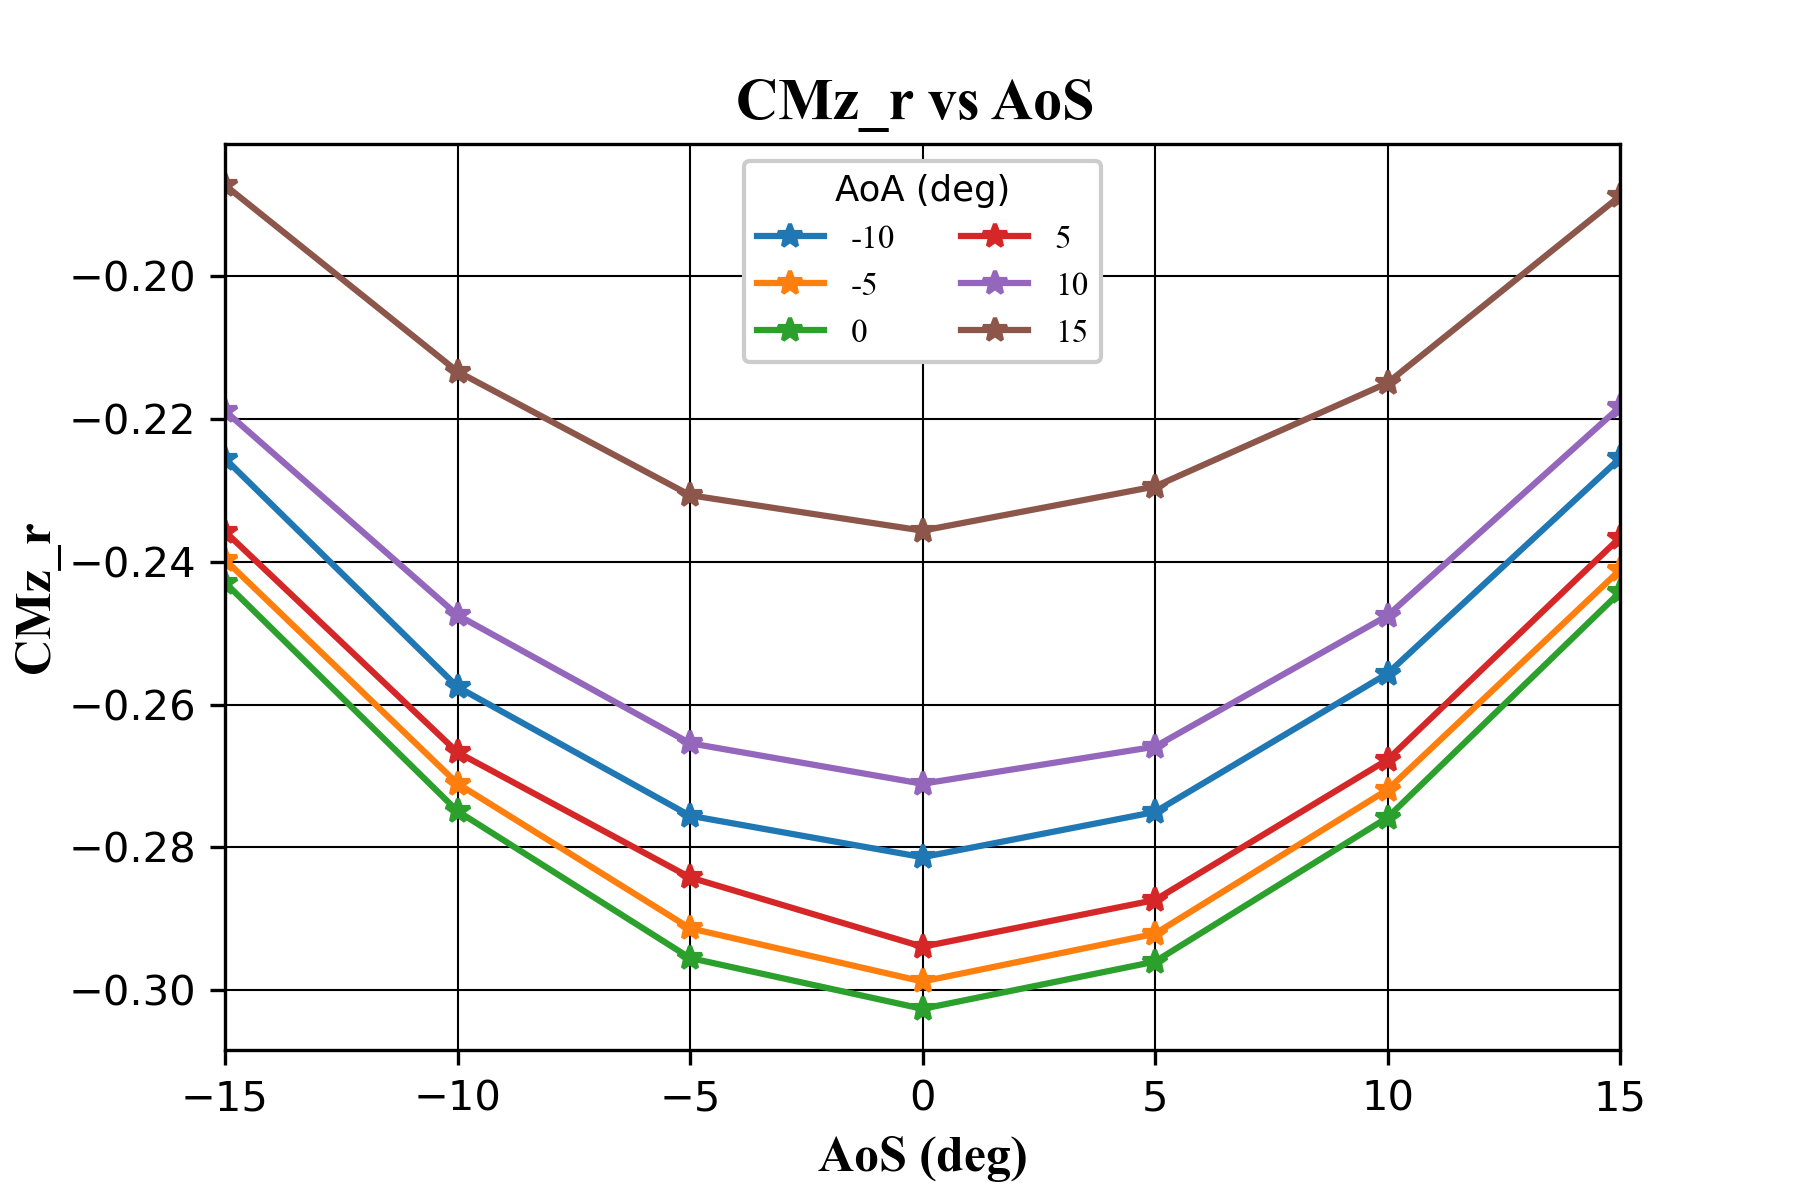
I followed the best practices mentioned in the workshop (updated tesselation and clustering) and connected the horizontal tail surfaces. The irregularities observed in the data reduced significantly for coefficients CMx_p and CMy_q but the anomalies are still observed in CMz_r. Please find the plot below. (OpenVSP version 3.30 was used)
I regenerated the data using OpenVSP version 3.21.1 and the irregularities were not present. Please find the plot below.
If possible can you please tell us what could be causing this? Also, would you recommend using version 3.21.1 to generate dynamic derivatives or use the latest version and accept the irregularities?
Thank you very much
Respon a tots
Respon a l'autor
Reenvia
0 missatges nous