nginx 生产环境内存持续很高
2,464 views
Skip to first unread message

Lucien Li
Oct 17, 2013, 12:02:06 AM10/17/13
to open...@googlegroups.com
hi,请教大家,由于公司需要,我们用nginx来cache网站的页面,根据页面自己身上设置cache-control max-age来cache的时长,cache尊源。
但是我们上线会,发现nginx内存持续升高直到接近系统的内存,发现它会自己降下来,按道理nginx不应该会这么耗内存的吧。查了下相关的资料发现论坛里面有说是lua module,ngx.var.XXX 引起的,也下载过systemstp 工具,由于自己是搞开发的,对系统内核这方面不是很了解,工具也不是很会使用。
希望大家能帮忙提出相关优化nginx的及系统内核的点。在此非常感激。
对外,如果用nginx proxy cache ,那nginx能承受的住吗? 例如:淘宝的双11,秒杀等活动。希望,有这方面的经验的朋友帮忙指点指点。感谢了!
以下是我的配置
系统:centos 6.3
内存:126G
磁盘:1.8T (raid0 7块磁盘)
网卡:万兆
系统里面有记下表示拿不定主意:
open_file_cache,开启gzip(时时压缩),keepalive_requests默认是100, 改大了,等等。
user nginx nginx;
worker_processes 32;
worker_rlimit_nofile 65535;
error_log logs/error.log error;
google_perftools_profiles /tmp/tcmalloc;
events {
use epoll;
worker_connections 65535;
}
http {
include mime.types;
default_type text/plain;
server_tokens off;
server_names_hash_bucket_size 128;
client_header_buffer_size 4k;
large_client_header_buffers 4 32k;
client_max_body_size 300m;
lua_package_path "/usr/local/nginx/conf/hash/?.lua;;";
lua_code_cache on;
#proxy_intercept_errors off;
log_format main '$time_iso8601 $request_uri $status'
' $bytes_sent $upstream_cache_status'
' $request_time'
' $upstream_response_time'
' $host'
' $remote_addr'
' $server_addr'
' $upstream_addr'
' $http_referer'
' $http_user_agent'
' $http_X_Forwarded_For'
' 1'
' $cachezone';
access_log logs/access.log main;
sendfile on;
tcp_nopush on;
keepalive_timeout 15;
send_timeout 2;
keepalive_requests 1000000;
open_file_cache max=65535 inactive=20s;
open_file_cache_min_uses 1;
open_file_cache_valid 30s;
gzip on;
gzip_min_length 1k;
gzip_buffers 4 16k;
gzip_http_version 1.1;
gzip_comp_level 2;
gzip_vary on;
gzip_types text/plain application/x-javascript text/css application/xml;
client_body_timeout 10;
client_body_buffer_size 512k;
proxy_connect_timeout 30;
proxy_read_timeout 30;
proxy_send_timeout 30;
proxy_buffer_size 64k;
proxy_buffers 4 64k;
proxy_busy_buffers_size 128k;
proxy_temp_file_write_size 128k;
proxy_temp_path /tmp;
proxy_cache_path /home/disk1/tmp levels=1:2 keys_zone=cache1:2048m inactive=7d max_size=245g;
proxy_cache_path /home/disk2/tmp levels=1:2 keys_zone=cache2:2048m inactive=7d max_size=245g;
proxy_cache_path /home/disk3/tmp levels=1:2 keys_zone=cache3:2048m inactive=7d max_size=245g;
proxy_cache_path /home/disk4/tmp levels=1:2 keys_zone=cache4:2048m inactive=7d max_size=245g;
proxy_cache_path /home/disk5/tmp levels=1:2 keys_zone=cache5:2048m inactive=7d max_size=245g;
proxy_cache_path /home/disk6/tmp levels=1:2 keys_zone=cache6:2048m inactive=7d max_size=245g;
proxy_cache_path /home/disk7/tmp levels=1:2 keys_zone=cache7:2048m inactive=7d max_size=245g;
limit_conn_zone $status zone=addr:10m;
##### m
upstream test {
server 192.168.100.10 weight=30 max_fails=2 fail_timeout=10s;
}
#resolver 8.8.8.8;
server {
listen 192.168.100.2:80;
server_name ~(?<domain>.+\.test)\.com$;
location / {
set_by_lua_file $cachezone /usr/local/nginx/conf/hash/parser.lua; #consistent_hash ngx.req.get_headers()["Host"]..ngx.var.uri
if ( $cachezone = "cache1" ) {
rewrite ^ /cache1;
}
if ( $cachezone = "cache2" ) {
rewrite ^ /cache2;
}
if ( $cachezone = "cache3" ) {
rewrite ^ /cache3;
}
if ( $cachezone = "cache4" ) {
rewrite ^ /cache4;
}
if ( $cachezone = "cache5" ) {
rewrite ^ /cache5;
}
if ( $cachezone = "cache6" ) {
rewrite ^ /cache6;
}
if ( $cachezone = "cache7" ) {
rewrite ^ /cache7;
}
}
location /cache1 {
internal;
proxy_cache cache1;
limit_conn addr 2500;
proxy_next_upstream http_502 http_504 error timeout invalid_header;
proxy_cache_valid 200 304 10m;
proxy_cache_valid 301 302 1m;
proxy_cache_key $host$request_uri;
proxy_set_header Host $host;
proxy_set_header X-Forwarded-For $remote_addr;
proxy_pass http://$domain$request_uri;
proxy_errors_log_upstream http_500 http_404;
proxy_cache_lock on;
proxy_cache_lock_timeout 32;
proxy_cache_bypass $cookie_nocache $arg_nocache;
proxy_cache_use_stale error timeout http_500 http_502 http_503 http_504;
proxy_no_cache $sent_http_x_nomirror;
#proxy_intercept_errors on;
}
#cache2,cache3,cache4,cache5……
location ~* \/ga.aspx\?*$ {
proxy_next_upstream http_502 http_504 error timeout invalid_header;
proxy_set_header Host $host;
proxy_set_header X-Forwarded-For $remote_addr;
proxy_pass http://$domain;
}
location ~* \/error/50x.aspx$ {
proxy_next_upstream http_502 http_504 error timeout invalid_header;
proxy_set_header Host $host;
proxy_set_header X-Forwarded-For $remote_addr;
proxy_pass http://$domain;
}
error_page 404 500 502 503 504 /50x.html;
location = /50x.html {
root html;
}
sysguard on;
sysguard_load load=32 action=/loadlimit;
sysguard_mem swapratio=20% action=/swaplimit;
location /loadlimit {
return 503;
}
location /swaplimit {
return 503;
}
location /nginx-status {
stub_status on;
allow 192.168.101.0/24;
deny all;
access_log off;
}
}
}

Yichun Zhang (agentzh)
Oct 17, 2013, 12:37:58 AM10/17/13
to openresty
Hello!
On Wed, Oct 16, 2013 at 9:02 PM, Lucien Li wrote:
> 但是我们上线会,发现nginx内存持续升高直到接近系统的内存,发现它会自己降下来,按道理nginx不应该会这么耗内存的吧。查了下相关的资料发现论坛里面有说是lua
> module,ngx.var.XXX 引起的,也下载过systemstp 工具,由于自己是搞开发的,对系统内核这方面不是很了解,工具也不是很会使用。
> 希望大家能帮忙提出相关优化nginx的及系统内核的点。在此非常感激。
> 对外,如果用nginx proxy cache ,那nginx能承受的住吗?
> 例如:淘宝的双11,秒杀等活动。希望,有这方面的经验的朋友帮忙指点指点。感谢了!
>
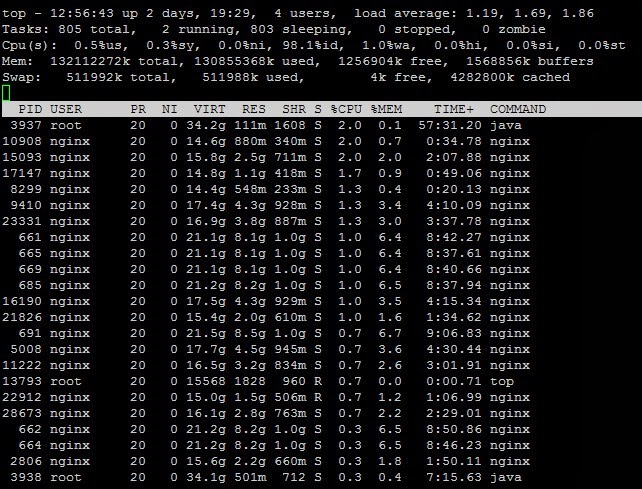
请提供具体的相关细节,例如 nginx worker 进程的内存占用值(包括 RES, VIRT, SHR 等指标,你可以在 top 等工具里得到)。
另外,建议使用 pmap -d <pid> 命令得到最后一行输出,可以贴出来看一下。最有意思的是 writeable/private 这一项的值。
如果你怀疑是 Lua VM 分配的空间过大,请使用下面的工具加以确认:
https://github.com/agentzh/stapxx#ngx-lj-gc
https://github.com/agentzh/stapxx#ngx-lj-gc-objs
如果是你的 nginx 中的共享内存区域占用过大,可以使用 ngx-shm 和 ngx-lua-shdict 工具加以确认:
https://github.com/agentzh/nginx-systemtap-toolkit#ngx-shm
https://github.com/agentzh/nginx-systemtap-toolkit#ngx-lua-shdict
你不需要对内核有太多的知识,你只需要稍微学习一下如何使用这些命令行工具和解释其输出 :)
Best regards,
-agentzh
On Wed, Oct 16, 2013 at 9:02 PM, Lucien Li wrote:
> 但是我们上线会,发现nginx内存持续升高直到接近系统的内存,发现它会自己降下来,按道理nginx不应该会这么耗内存的吧。查了下相关的资料发现论坛里面有说是lua
> module,ngx.var.XXX 引起的,也下载过systemstp 工具,由于自己是搞开发的,对系统内核这方面不是很了解,工具也不是很会使用。
> 希望大家能帮忙提出相关优化nginx的及系统内核的点。在此非常感激。
> 对外,如果用nginx proxy cache ,那nginx能承受的住吗?
> 例如:淘宝的双11,秒杀等活动。希望,有这方面的经验的朋友帮忙指点指点。感谢了!
>
另外,建议使用 pmap -d <pid> 命令得到最后一行输出,可以贴出来看一下。最有意思的是 writeable/private 这一项的值。
如果你怀疑是 Lua VM 分配的空间过大,请使用下面的工具加以确认:
https://github.com/agentzh/stapxx#ngx-lj-gc
https://github.com/agentzh/stapxx#ngx-lj-gc-objs
如果是你的 nginx 中的共享内存区域占用过大,可以使用 ngx-shm 和 ngx-lua-shdict 工具加以确认:
https://github.com/agentzh/nginx-systemtap-toolkit#ngx-shm
https://github.com/agentzh/nginx-systemtap-toolkit#ngx-lua-shdict
你不需要对内核有太多的知识,你只需要稍微学习一下如何使用这些命令行工具和解释其输出 :)
Best regards,
-agentzh
Lucien Li
Oct 17, 2013, 1:22:44 AM10/17/13
to open...@googlegroups.com

mapped: 22085628K writeable/private: 7357612K shared: 14690308K
抱歉我的内核是 uname -r
2.6.32-358.el6.x86_64
我看章老师你写的工具必须是要3.5的内核,我不知道对于生产环境如果升级内核会不会有影响,所以有些nginx-systemtap-toolkit 部分使用不了。
在 2013年10月17日星期四UTC+8下午12时37分58秒,agentzh写道:
Lucien Li
Oct 17, 2013, 1:24:52 AM10/17/13
to open...@googlegroups.com
Tracing 669 (/usr/local/nginx/sbin/nginx)...
shm zone "cache1"
owner: ngx_http_file_cache
total size: 2097152 KB
shm zone "cache2"
owner: ngx_http_file_cache
total size: 2097152 KB
shm zone "cache3"
owner: ngx_http_file_cache
total size: 2097152 KB
shm zone "cache4"
owner: ngx_http_file_cache
total size: 2097152 KB
shm zone "cache5"
owner: ngx_http_file_cache
total size: 2097152 KB
shm zone "cache6"
owner: ngx_http_file_cache
total size: 2097152 KB
shm zone "cache7"
owner: ngx_http_file_cache
total size: 2097152 KB
shm zone "addr"
owner: ngx_http_limit_conn
total size: 10240 KB
Use the -n <zone> option to see more details about each zone.
36 microseconds elapsed in the probe.
在 2013年10月17日星期四UTC+8下午1时22分44秒,Lucien Li写道:
Yichun Zhang (agentzh)
Oct 17, 2013, 2:55:03 AM10/17/13
to openresty
Hello!
2013/10/16 Lucien Li
最多也只能用满 4G 的地址空间(在 x86_64 上默认最多只有 1GB)。看起来很可能是你使用的某个第三方的 nginx
模块存在内存泄漏。
确认 LuaJIT VM 本身的内存使用,至少需要使用 ngx-lj-gc 这个工具。除非你喜欢自己猜的话。。。
追踪 C 级别的内存泄漏位置,可以使用经典的“内存泄漏火焰图”工具,见 Brendan Gregg 的下面这篇博客里的介绍:
http://dtrace.org/blogs/brendan/2013/08/16/memory-leak-growth-flame-graphs/
你可以直接使用文中提及的我编写的 systemtap 脚本,leaks.stp.
> 我看章老师你写的工具必须是要3.5的内核,我不知道对于生产环境
> 如果升级内核会不会有影响,所以有些nginx-systemtap-toolkit 部分
> 使用不了。
这是对主线版本的 Linux 内核的版本要求。如果你使用的是 RedHat 系的发行版(Fedora, RHEL, 或
CentOS)自带的内核,则并不要求 3.5 这么高的版本。
Regards,
-agentzh
2013/10/16 Lucien Li
>
> pmap -d 669
> mapped: 22085628K writeable/private: 7357612K shared: 14690308K
>
这里 writeable/private 的值竟然达到 7 个 GB. 如果你使用的是 LuaJIT 2.x 的话,LuaJIT VM
> pmap -d 669
> mapped: 22085628K writeable/private: 7357612K shared: 14690308K
>
最多也只能用满 4G 的地址空间(在 x86_64 上默认最多只有 1GB)。看起来很可能是你使用的某个第三方的 nginx
模块存在内存泄漏。
确认 LuaJIT VM 本身的内存使用,至少需要使用 ngx-lj-gc 这个工具。除非你喜欢自己猜的话。。。
追踪 C 级别的内存泄漏位置,可以使用经典的“内存泄漏火焰图”工具,见 Brendan Gregg 的下面这篇博客里的介绍:
http://dtrace.org/blogs/brendan/2013/08/16/memory-leak-growth-flame-graphs/
你可以直接使用文中提及的我编写的 systemtap 脚本,leaks.stp.
> 我看章老师你写的工具必须是要3.5的内核,我不知道对于生产环境
> 如果升级内核会不会有影响,所以有些nginx-systemtap-toolkit 部分
> 使用不了。
这是对主线版本的 Linux 内核的版本要求。如果你使用的是 RedHat 系的发行版(Fedora, RHEL, 或
CentOS)自带的内核,则并不要求 3.5 这么高的版本。
Regards,
-agentzh
Lucien Li
Oct 17, 2013, 11:31:18 PM10/17/13
to open...@googlegroups.com
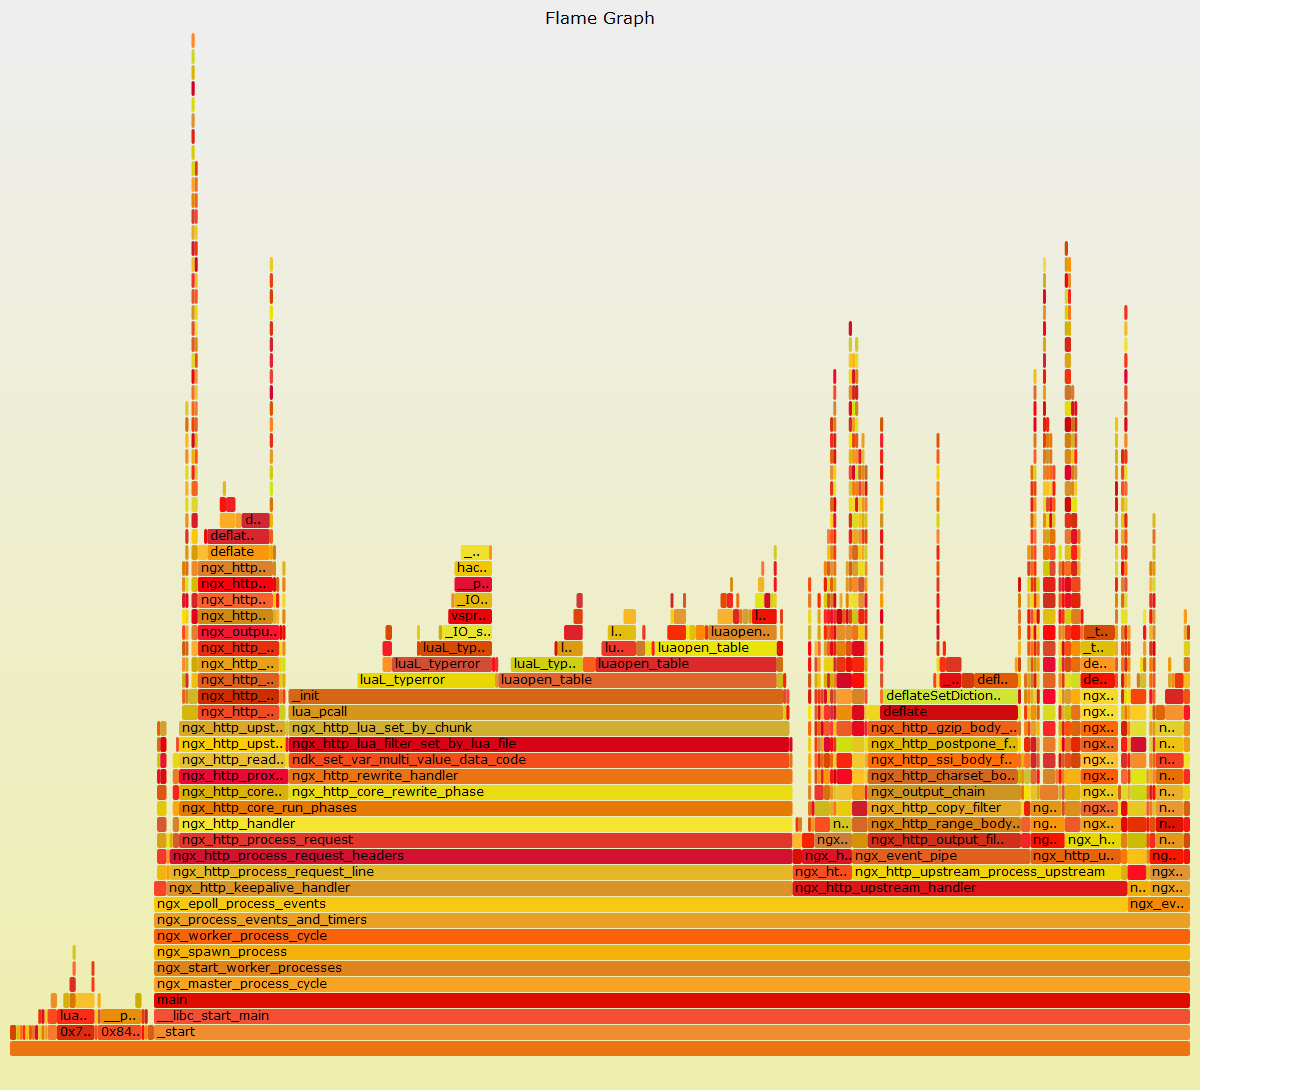
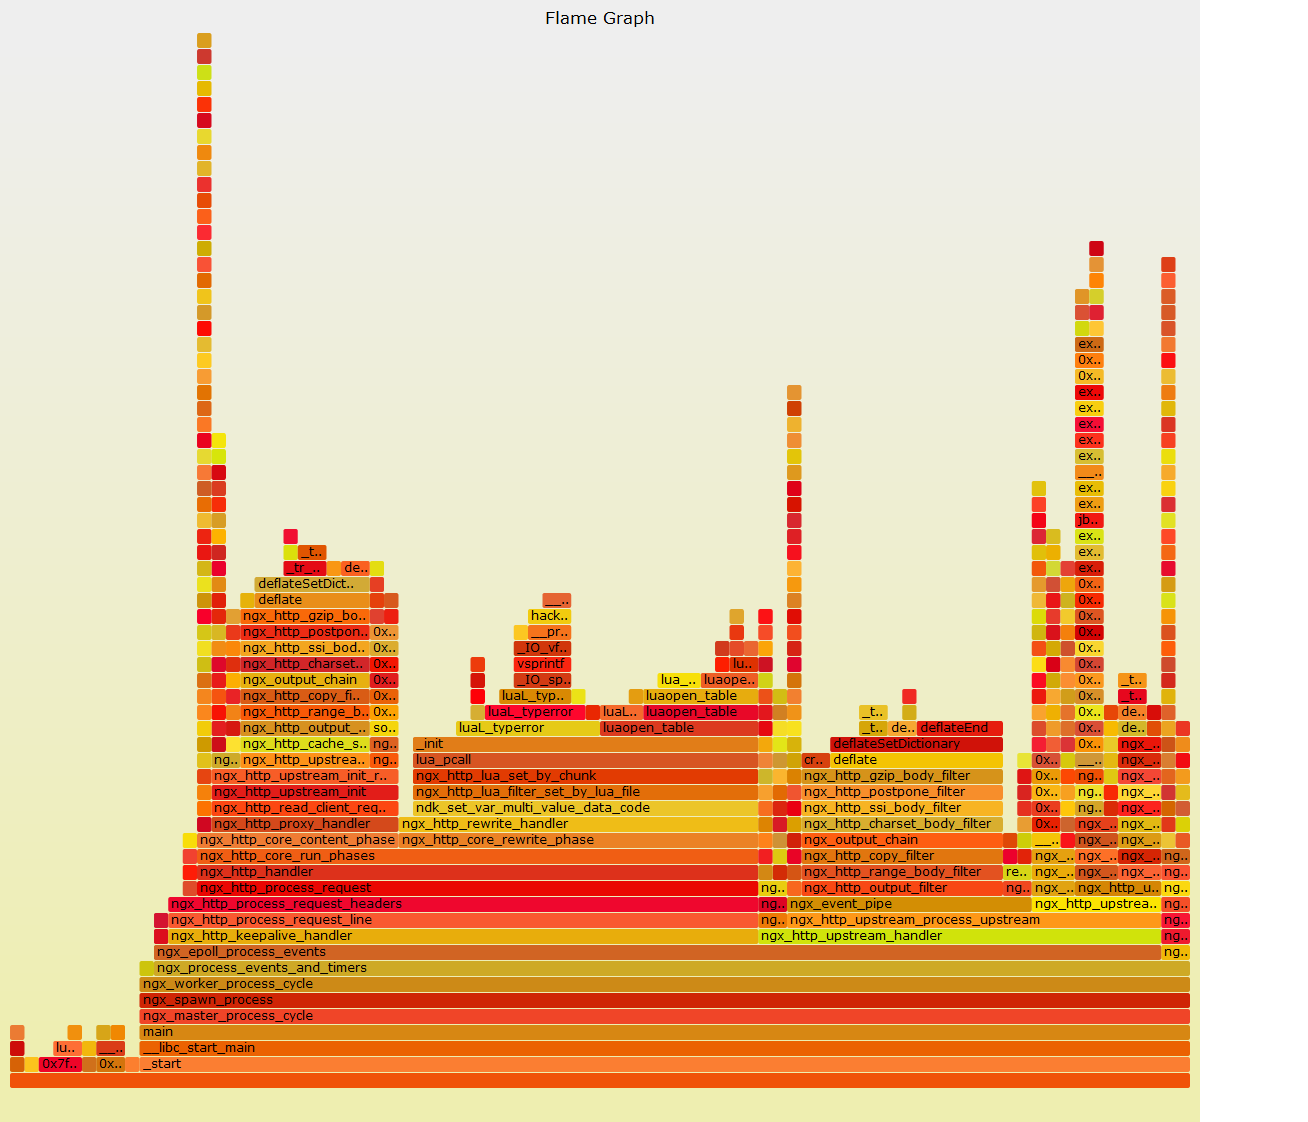
采样了几个时间段的nginx,并且reload之后也采样了下火焰图,但是我对火焰图不是很了解~希望章老师帮忙看看,现在nginx 内存很高!
mapped: 19673112K writeable/private: 4945100K shared: 14690308K

在 2013年10月17日星期四UTC+8下午2时55分03秒,agentzh写道:
Yichun Zhang (agentzh)
Oct 18, 2013, 3:59:11 AM10/18/13
to openresty
Hello!
2013/10/17 Lucien Li
on-CPU 火焰图主要用于分析 CPU 使用率高的问题,而不是内存使用过大的问题。分析内存泄漏需要使用“内存泄漏火焰图”,见 stap++
项目中的 sample-bt-leaks
工具:https://github.com/agentzh/stapxx#sample-bt-leaks
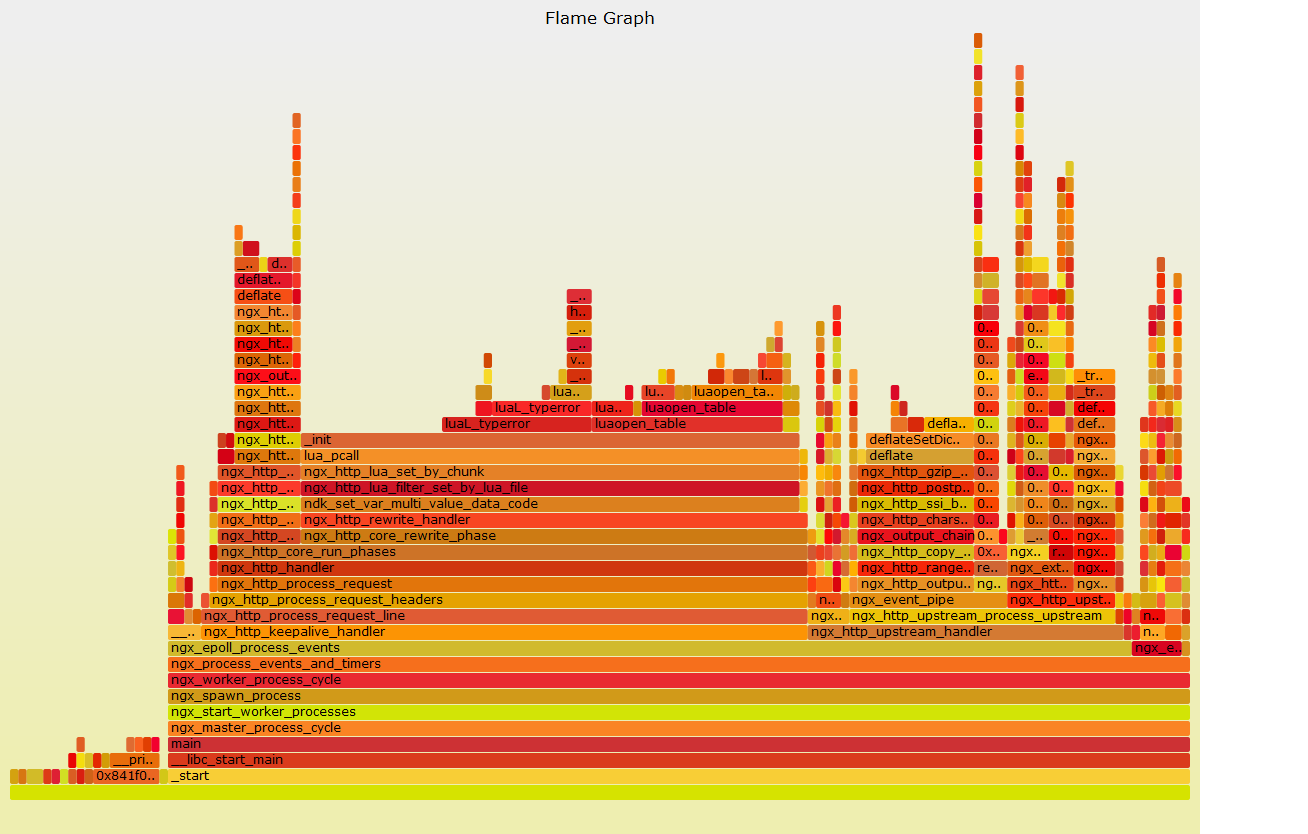
就 on-CPU 火焰图而言,你的 Lua 代码明显有问题:
1. 你在反复重新加载标准的 Lua table 库(注意你的 on-CPU 火焰图中的 luaopen_table 帧)。
2. 你的 Lua 代码频繁地抛出 Lua 类型错误的异常(注意你的 on-CPU 火焰图中的 luaL_typerror 帧)。
对于问题 2,建议仔细检查一下你的 Lua 代码逻辑。特别是在你的 pcall 调用之后把捕获的 Lua 错误消息输出到 nginx 错误日志这样的地方。例如
local rc, err = pcall(...)
if not rc then ngx.log(ngx.ERR, "Lua pcall failed: ", err) end
这样你就可以在 nginx 错误日志文件中找到具体的错误,从而修复你的 Lua 代码中的类型错误问题。
对于问题 1,如果你无法定位,请提供最小化的 Lua 代码。
当然,你也可以使用 ngx-sample-lua-bt 工具生成 Lua 代码级别的火焰图:
https://github.com/agentzh/nginx-systemtap-toolkit#ngx-sample-lua-bt
这样更容易在你的 Lua 代码中定位问题所在的位置。
当然,上面这些针对你提供的 on-CPU 火焰图的分析主要是可以降低你的 nginx 的 CPU
使用率。这些优化并不一定能解决你最关心的内存问题。但我建议你还是先修复一下你 Lua 代码中的这些显然的问题,因为有可能和你的内存问题有关。
关于内存问题,我有如下建议:
1. 再问一遍:你能使用 ngx-lj-gc 工具分析你最大的 nginx worker 进程么?你使用的是 LuaJIT 还是标准 Lua 解释器?
如果你实在无法使用 ngx-lj-gc 工具(当然,我仍然希望了解具体原因),你也可以使用下面这个接口来输出 Lua GC 分配的空间大小:
location = /luagc {
default_type text/plain;
content_by_lua '
ngx.say("Nginx worker pid: ", ngx.var.pid)
ngx.say("GC count: ", collectgarbage("count") * 1024, " bytes")
';
}
你可以使用浏览器或者 curl 这样的命令行工具请求这个 /luagc 接口,得到当前 worker 的 Lua GC 大小。一次典型的输出是
Nginx worker pid: 3835
GC count: 45981 bytes
我们需要排除或者确认你的 Lua VM 泄漏内存的可能性。
2. 你能使用 Nginx Systemtap Toolkit 的 ngx-cycle-pool 分析一下你最 大的 nginx worker 进程么?见
https://github.com/agentzh/nginx-systemtap-toolkit#ngx-cycle-pool
我们需要排除一下 nginx cycle pool 里的泄漏的可能性。
3. 你能使用 Nginx Systemtap Toolkit 中的 ngx-active-reqs 工具分析一下你最大的 nginx
worker 进程中每请求的内存池的内存使用情况么?见
https://github.com/agentzh/nginx-systemtap-toolkit#ngx-active-reqs
记得指定 -m 选项。
4. 为你的 nginx 生成“内存泄漏火焰图”,而不是其他类型的火焰图。细节见
https://github.com/agentzh/stapxx#sample-bt-leaks
这个脚本其实在我之前的邮件中所引用的 Brendan Gregg 的文章中有提及。
Best regards,
-agentzh
2013/10/17 Lucien Li
>
> 采样了几个时间段的nginx,并且reload之后也采样了下火焰图,但是我对火焰图不是很了解~希望章老师帮忙看看,现在nginx 内存很高!
>
很高兴看到你能生成火焰图,不过你提供的火焰图是用 sample-bt 工具生成的 on-CPU 火焰图吧?
> 采样了几个时间段的nginx,并且reload之后也采样了下火焰图,但是我对火焰图不是很了解~希望章老师帮忙看看,现在nginx 内存很高!
>
on-CPU 火焰图主要用于分析 CPU 使用率高的问题,而不是内存使用过大的问题。分析内存泄漏需要使用“内存泄漏火焰图”,见 stap++
项目中的 sample-bt-leaks
工具:https://github.com/agentzh/stapxx#sample-bt-leaks
就 on-CPU 火焰图而言,你的 Lua 代码明显有问题:
1. 你在反复重新加载标准的 Lua table 库(注意你的 on-CPU 火焰图中的 luaopen_table 帧)。
2. 你的 Lua 代码频繁地抛出 Lua 类型错误的异常(注意你的 on-CPU 火焰图中的 luaL_typerror 帧)。
对于问题 2,建议仔细检查一下你的 Lua 代码逻辑。特别是在你的 pcall 调用之后把捕获的 Lua 错误消息输出到 nginx 错误日志这样的地方。例如
local rc, err = pcall(...)
if not rc then ngx.log(ngx.ERR, "Lua pcall failed: ", err) end
这样你就可以在 nginx 错误日志文件中找到具体的错误,从而修复你的 Lua 代码中的类型错误问题。
对于问题 1,如果你无法定位,请提供最小化的 Lua 代码。
当然,你也可以使用 ngx-sample-lua-bt 工具生成 Lua 代码级别的火焰图:
https://github.com/agentzh/nginx-systemtap-toolkit#ngx-sample-lua-bt
这样更容易在你的 Lua 代码中定位问题所在的位置。
当然,上面这些针对你提供的 on-CPU 火焰图的分析主要是可以降低你的 nginx 的 CPU
使用率。这些优化并不一定能解决你最关心的内存问题。但我建议你还是先修复一下你 Lua 代码中的这些显然的问题,因为有可能和你的内存问题有关。
关于内存问题,我有如下建议:
1. 再问一遍:你能使用 ngx-lj-gc 工具分析你最大的 nginx worker 进程么?你使用的是 LuaJIT 还是标准 Lua 解释器?
如果你实在无法使用 ngx-lj-gc 工具(当然,我仍然希望了解具体原因),你也可以使用下面这个接口来输出 Lua GC 分配的空间大小:
location = /luagc {
default_type text/plain;
content_by_lua '
ngx.say("Nginx worker pid: ", ngx.var.pid)
ngx.say("GC count: ", collectgarbage("count") * 1024, " bytes")
';
}
你可以使用浏览器或者 curl 这样的命令行工具请求这个 /luagc 接口,得到当前 worker 的 Lua GC 大小。一次典型的输出是
Nginx worker pid: 3835
GC count: 45981 bytes
我们需要排除或者确认你的 Lua VM 泄漏内存的可能性。
2. 你能使用 Nginx Systemtap Toolkit 的 ngx-cycle-pool 分析一下你最 大的 nginx worker 进程么?见
https://github.com/agentzh/nginx-systemtap-toolkit#ngx-cycle-pool
我们需要排除一下 nginx cycle pool 里的泄漏的可能性。
3. 你能使用 Nginx Systemtap Toolkit 中的 ngx-active-reqs 工具分析一下你最大的 nginx
worker 进程中每请求的内存池的内存使用情况么?见
https://github.com/agentzh/nginx-systemtap-toolkit#ngx-active-reqs
记得指定 -m 选项。
4. 为你的 nginx 生成“内存泄漏火焰图”,而不是其他类型的火焰图。细节见
https://github.com/agentzh/stapxx#sample-bt-leaks
这个脚本其实在我之前的邮件中所引用的 Brendan Gregg 的文章中有提及。
Best regards,
-agentzh
Lucien Li
Oct 18, 2013, 6:52:28 AM10/18/13
to open...@googlegroups.com
感谢您的回复,我这几天一直在解决为啥,有些脚本不能执行,我对系统这方面不是很了解所以查起来比较费力,希望能帮忙看看!
在 2013年10月18日星期五UTC+8下午3时59分11秒,agentzh写道:
[root@u5c1001 samples]# ./sample-bt-leaks.sxx -x 3409 --arg time=5 -D STP_NO_OVERLOAD > a.bt
WARNING: cannot find module /lib64/libc-2.12.so debuginfo: No DWARF information found [man warning::debuginfo]
semantic error: while resolving probe point: identifier 'process' at <input>:16:7
source: probe process("/lib*/libc.so*").function("malloc").return
^
semantic error: no match
semantic error: while resolving probe point: identifier 'process' at :39:7
source: probe process("/lib*/libc.so*").function("free")
^
Pass 2: analysis failed. [man error::pass2]
在 2013年10月18日星期五UTC+8下午3时59分11秒,agentzh写道:
Yichun Zhang (agentzh)
Oct 18, 2013, 3:19:13 PM10/18/13
to openresty
Hello!
2013/10/18 Lucien Li:
系统上,我是通过下面这条命令安装的:
sudo yum install glibc-debuginfo
由于你没有提供你使用的操作系统的具体信息,所以我无法给出更具体的命令。
Regards,
-agentzh
2013/10/18 Lucien Li:
> [root@u5c1001 samples]# ./sample-bt-leaks.sxx -x 3409 --arg time=5 -D
> STP_NO_OVERLOAD > a.bt
> WARNING: cannot find module /lib64/libc-2.12.so debuginfo: No DWARF
> information found [man warning::debuginfo]
> semantic error: while resolving probe point: identifier 'process' at
> <input>:16:7
> source: probe process("/lib*/libc.so*").function("malloc").return
> ^
>
这个错误是说你的系统里的 glibc 库缺少 DWARF 调试信息。你需要在你的系统中单独安装对应的调试信息包。例如,在我的 Fedora
> STP_NO_OVERLOAD > a.bt
> WARNING: cannot find module /lib64/libc-2.12.so debuginfo: No DWARF
> information found [man warning::debuginfo]
> semantic error: while resolving probe point: identifier 'process' at
> <input>:16:7
> source: probe process("/lib*/libc.so*").function("malloc").return
> ^
>
系统上,我是通过下面这条命令安装的:
sudo yum install glibc-debuginfo
由于你没有提供你使用的操作系统的具体信息,所以我无法给出更具体的命令。
Regards,
-agentzh

lylee1981
Oct 21, 2013, 4:22:22 AM10/21/13
to open...@googlegroups.com
hi,agentzh
我在我同事的基础上,再向你求助2个问题:
WARNING: cannot find module /usr/local/lib/libluajit-5.1.so.2.0.0 debuginfo: No DWARF information found [man warning::debuginfo]
semantic error: while resolving probe point: identifier 'process' at <input>:11:7
source: probe process("/usr/local/lib/libluajit-5.1.so.2.0.0").function("lua_resume"),
我在我同事的基础上,再向你求助2个问题:
问题一:[root@u5c1001 nginx-systemtap-toolkit]# ./ngx-sample-lua-bt -p 16798 -t 30 --luajit20 > a.bt
在使用 ngx-sample-lua-bt 工具生成 Lua 代码级别的火焰图,运行报错
看了一下细节,应该是缺少 libluajit的debuginfo,如下:
WARNING: cannot find module /usr/local/lib/libluajit-5.1.so.2.0.0 debuginfo: No DWARF information found [man warning::debuginfo]
semantic error: while resolving probe point: identifier 'process' at <input>:11:7
source: probe process("/usr/local/lib/libluajit-5.1.so.2.0.0").function("lua_resume"),
^
semantic error: no match
semantic error: while resolving probe point: identifier 'process' at :12:5
source: process("/usr/local/lib/libluajit-5.1.so.2.0.0").function("lua_pcall")
^
semantic error: while resolving probe point: identifier 'process' at :22:7
source: probe process("/usr/local/lib/libluajit-5.1.so.2.0.0").function("lua_yield") {
^
搜了一下没有找到具体要安装的命令,尝试使用如下命令,但还是报错。
[root@u5c1001 nginx-systemtap-toolkit]# yum install glibluajit-debuginfo 或者 yum install libluajit-debuginfo
Loaded plugins: fastestmirror, security
Loading mirror speeds from cached hostfile
* base: mirrors.btte.net
* extras: mirrors.btte.net
* rpmforge: apt.sw.be
* updates: mirrors.btte.net
Setting up Install Process
No package glibluajit-debuginfo available.
Error: Nothing to do
我们内核版本:
![]()
操作系统版本:
![]()
问题二:关于出现luaL_typerror,该如何定位到lua中有问题的代码
我们在nginx配置中会使用 set_by_lua_file 调用一个lua文件,根据$cachezone返回值,做后续的处理
![]()
目前parser.lua 代码已经精简到最简单,在parser.lua内部直接返回 一个变量,就结束了
eg:
return "cache1"
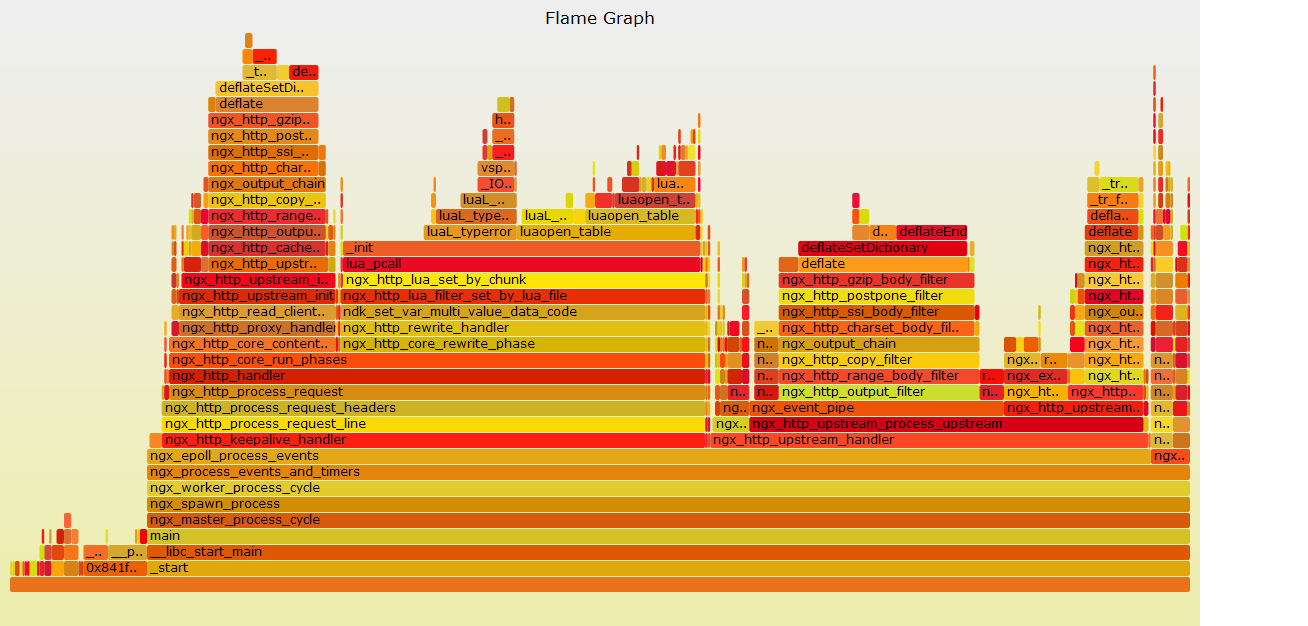
我们通过测试sample-bt得出的火焰图,仍然有 luaL_typerror。如下图
![]()
我们lua的环境:
![]()
我们想了解一下
1. 只是调用了一个最简单的lua,为什么会有 luaL_typerror出现,是否需要我们升级或降低lua版本
2. 关于 luaL_typerror的问题,你有没有什么好的工具或方法,让我们比较方便的查询到这种错误
你之前在邮件中有提过使用如下办法处理
![]()
但是我们在lua代码中并没有主动执行 pcall调用,是否还有其他办法可以使用,期待你的邮件
source: process("/usr/local/lib/libluajit-5.1.so.2.0.0").function("lua_pcall")
^
semantic error: while resolving probe point: identifier 'process' at :22:7
source: probe process("/usr/local/lib/libluajit-5.1.so.2.0.0").function("lua_yield") {
^
搜了一下没有找到具体要安装的命令,尝试使用如下命令,但还是报错。
[root@u5c1001 nginx-systemtap-toolkit]# yum install glibluajit-debuginfo 或者 yum install libluajit-debuginfo
Loaded plugins: fastestmirror, security
Loading mirror speeds from cached hostfile
* base: mirrors.btte.net
* extras: mirrors.btte.net
* rpmforge: apt.sw.be
* updates: mirrors.btte.net
Setting up Install Process
No package glibluajit-debuginfo available.
Error: Nothing to do
我们内核版本:
操作系统版本:
问题二:关于出现luaL_typerror,该如何定位到lua中有问题的代码
我们在nginx配置中会使用 set_by_lua_file 调用一个lua文件,根据$cachezone返回值,做后续的处理
目前parser.lua 代码已经精简到最简单,在parser.lua内部直接返回 一个变量,就结束了
eg:
return "cache1"
我们通过测试sample-bt得出的火焰图,仍然有 luaL_typerror。如下图
我们lua的环境:
我们想了解一下
1. 只是调用了一个最简单的lua,为什么会有 luaL_typerror出现,是否需要我们升级或降低lua版本
2. 关于 luaL_typerror的问题,你有没有什么好的工具或方法,让我们比较方便的查询到这种错误
你之前在邮件中有提过使用如下办法处理
但是我们在lua代码中并没有主动执行 pcall调用,是否还有其他办法可以使用,期待你的邮件
 debuginfo: No DWARF
>> information found [man warning::debuginfo]
>> semantic error: while resolving probe point: identifier 'process' at
>> <input>:16:7
>>         source: probe process("/lib*/libc.so*").function("malloc").return
>>                       ^
>>
>
>这个错误是说你的系统里的 glibc 库缺少 DWARF 调试信息。你需要在你的系统中单独安装对应的调试信息包。例如,在我的 Fedora
>系统上,我是通过下面这条命令安装的:
>
>    sudo yum install glibc-debuginfo
>
>由于你没有提供你使用的操作系统的具体信息,所以我无法给出更具体的命令。
>
>Regards,
>-agentzh
>
>--
>--
>邮件来自列表“openresty”,专用于技术讨论!
>订阅: 请发空白邮件到 openresty...@googlegroups.com
>发言: 请发邮件到 open...@googlegroups.com
>退订: 请发邮件至 openresty+...@googlegroups.com
>归档: http://groups.google.com/group/openresty
>官网: http://openresty.org/
>仓库: https://github.com/agentzh/ngx_openresty
>教程: http://openresty.org/download/agentzh-nginx-tutorials-zhcn.html

kindy
Oct 21, 2013, 9:32:49 PM10/21/13
to open...@googlegroups.com
看了下你的设置,说些想法:
1. keepalive_requests 的意义在于保持 浏览器 和 nginx 服务器之间的连接保持多久。这个数字太大没有意义。
一般来说 50-100 足矣,因为一个 page 一般也就这么多请求,何况浏览器通常会同时开启多个连接。
2. 使用 agentzh 提供的
location = /luagc {
default_type text/plain;
content_by_lua '
ngx.say("Nginx worker pid: ", ngx.var.pid)
ngx.say("GC count: ", collectgarbage("count") * 1024, " bytes")
';
}
default_type text/plain;
content_by_lua '
ngx.say("Nginx worker pid: ", ngx.var.pid)
ngx.say("GC count: ", collectgarbage("count") * 1024, " bytes")
';
}
来查看 lua 使用的内存大小。
如果上面提供的是主要配置,那么估计不是 Lua 的缘故。
--
--
邮件来自列表“openresty”,专用于技术讨论!
订阅: 请发空白邮件到 openresty...@googlegroups.com
发言: 请发邮件到 open...@googlegroups.com
退订: 请发邮件至 openresty+...@googlegroups.com
归档: http://groups.google.com/group/openresty
官网: http://openresty.org/
仓库: https://github.com/agentzh/ngx_openresty
教程: http://openresty.org/download/agentzh-nginx-tutorials-zhcn.html
- - - - - - - - - - - -
林青(Kindy Lin)
Yichun Zhang (agentzh)
Oct 22, 2013, 4:26:06 PM10/22/13
to openresty
Hello!
2013/10/21 lylee1981
如果你是自己从 LuaJIT 官方源码安装的 LuaJIT 2.0,可以用下面的命令来构造:
make CCDEBUG=-g -B -j8
最好使用最新的 LuaJIT 2.0.2 发布。较老的版本中有内存泄漏问题。最新的 ngx_openresty 1.4.2.9 中自带的也是
LuaJIT 2.0.2.
如果你是用的第三方打的 LuaJIT 的二进制包,则可以安装对应的 -debuginfo 包。同时确认你使用的二进制包的版本号是否为
2.0.2. 不过我建议你最好还是直接从官方源码编译最新的 LuaJIT,或者干脆上 ngx_openresty 软件包。
> 问题二:关于出现luaL_typerror,该如何定位到lua中有问题的代码
>
> 我们在nginx配置中会使用 set_by_lua_file 调用一个lua文件,根据$cachezone返回值,做后续的处理
>
另外,你在你的 nginx 的错误日志文件里有看到 [error] 级别的错误信息么?当然,查看之前,请确认你是否正确地配置了
error_log 配置指令,不要使用 alert 或者 crit 这么高的日志过滤级别,因为那样你就看不到 [error] 级别的信息了。
> 如下图
>
建议把原始的 .svg 文件作为邮件附件,或者放在公网可见的某个地方。我在我的 gmail 客户端中无法看到你的图片,只是一段很长的 base64 编码文本。
Regards,
-agentzh
2013/10/21 lylee1981
>
> 问题一:
> 在使用 ngx-sample-lua-bt 工具生成 Lua 代码级别的火焰图,运行报错
> 看了一下细节,应该是缺少 libluajit的debuginfo,如下:
>
> [root@u5c1001 nginx-systemtap-toolkit]# ./ngx-sample-lua-bt -p 16798 -t 30 --luajit20 > a.bt
> WARNING: cannot find module /usr/local/lib/libluajit-5.1.so.2.0.0 debuginfo: No DWARF information found [man warning::debuginfo]
看起来你并没有使用 ngx_openresty 自带的 LuaJIT 2.0. 它默认就会启用 DWARF 调试信息,就像 nginx 那样。
> 问题一:
> 在使用 ngx-sample-lua-bt 工具生成 Lua 代码级别的火焰图,运行报错
> 看了一下细节,应该是缺少 libluajit的debuginfo,如下:
>
> [root@u5c1001 nginx-systemtap-toolkit]# ./ngx-sample-lua-bt -p 16798 -t 30 --luajit20 > a.bt
> WARNING: cannot find module /usr/local/lib/libluajit-5.1.so.2.0.0 debuginfo: No DWARF information found [man warning::debuginfo]
如果你是自己从 LuaJIT 官方源码安装的 LuaJIT 2.0,可以用下面的命令来构造:
make CCDEBUG=-g -B -j8
最好使用最新的 LuaJIT 2.0.2 发布。较老的版本中有内存泄漏问题。最新的 ngx_openresty 1.4.2.9 中自带的也是
LuaJIT 2.0.2.
如果你是用的第三方打的 LuaJIT 的二进制包,则可以安装对应的 -debuginfo 包。同时确认你使用的二进制包的版本号是否为
2.0.2. 不过我建议你最好还是直接从官方源码编译最新的 LuaJIT,或者干脆上 ngx_openresty 软件包。
> 问题二:关于出现luaL_typerror,该如何定位到lua中有问题的代码
>
> 我们在nginx配置中会使用 set_by_lua_file 调用一个lua文件,根据$cachezone返回值,做后续的处理
>
> 目前parser.lua 代码已经精简到最简单,在parser.lua内部直接返回 一个变量,就结束了
>
> eg:
> return "cache1"
>
> 我们通过测试sample-bt得出的火焰图,仍然有 luaL_typerror。
你能用一个最小化的但很完整的 nginx.conf 配置复现这里的问题么?这看起来很古怪。
>
> eg:
> return "cache1"
>
> 我们通过测试sample-bt得出的火焰图,仍然有 luaL_typerror。
另外,你在你的 nginx 的错误日志文件里有看到 [error] 级别的错误信息么?当然,查看之前,请确认你是否正确地配置了
error_log 配置指令,不要使用 alert 或者 crit 这么高的日志过滤级别,因为那样你就看不到 [error] 级别的信息了。
> 如下图
>
建议把原始的 .svg 文件作为邮件附件,或者放在公网可见的某个地方。我在我的 gmail 客户端中无法看到你的图片,只是一段很长的 base64 编码文本。
Regards,
-agentzh
Lucien Li
Oct 22, 2013, 10:03:31 PM10/22/13
to open...@googlegroups.com

在 2013年10月23日星期三UTC+8上午4时26分06秒,agentzh写道:
Yichun Zhang (agentzh)
Oct 23, 2013, 12:31:51 AM10/23/13
to openresty
Hello!
2013/10/22 Lucien Li
>
> 感谢章老师的回复,我们刚开始用的是LuaJIT2.0.0有内存泄露,最后尝试着升级到LuaJIT2.0.2之后就好了!
问题解决了就好。
> 顺便请教下这个问题?应该属于环境的问题!
>
正如我前一封邮件提到的,LuaJIT 较老的版本(例如 2.0.0)包含有已知的内存泄漏的
bug,在后续的稳定版发布中已经修复了。这也是我推荐你使用最新的 LuaJIT 2.0.2 的原因。
Regards,
-agentzh
2013/10/22 Lucien Li
>
> 感谢章老师的回复,我们刚开始用的是LuaJIT2.0.0有内存泄露,最后尝试着升级到LuaJIT2.0.2之后就好了!
问题解决了就好。
> 顺便请教下这个问题?应该属于环境的问题!
>
正如我前一封邮件提到的,LuaJIT 较老的版本(例如 2.0.0)包含有已知的内存泄漏的
bug,在后续的稳定版发布中已经修复了。这也是我推荐你使用最新的 LuaJIT 2.0.2 的原因。
Regards,
-agentzh
Lucien
Jan 1, 2014, 7:52:19 PM1/1/14
to open...@googlegroups.com
感谢你的回复,发现了部分问题,正在解决中,非常感谢~
-----邮件原件-----
发件人: openresty+bncbcqlxfp4t...@googlegroups.com
[mailto:openresty+bncbcqlxfp4t...@googlegroups.com] 代表
Yichun Zhang (agentzh)
发送时间: 2013年10月18日 15:59
收件人: openresty
主题: Re: [openresty] nginx 生产环境内存持续很高
-----邮件原件-----
发件人: openresty+bncbcqlxfp4t...@googlegroups.com
[mailto:openresty+bncbcqlxfp4t...@googlegroups.com] 代表
Yichun Zhang (agentzh)
发送时间: 2013年10月18日 15:59
收件人: openresty
主题: Re: [openresty] nginx 生产环境内存持续很高

小冶
Jan 2, 2014, 9:44:34 AM1/2/14
to open...@googlegroups.com
这个帖子真是神作。。。看到那么多高大上的工具。。和那么牛逼的配置主机。。。还有那么强悍的bug。。。
可是最后真有点虎头蛇尾之嫌。。竟然是换个luajit就完事了。。。
在 2013年10月23日星期三UTC+8下午12时31分51秒,agentzh写道:
在 2013年10月23日星期三UTC+8下午12时31分51秒,agentzh写道:
Reply all
Reply to author
Forward
0 new messages