Gradient Data from DEM/DTM against Track Centre Line model
201 views
Skip to first unread message

Stuart Gordon
Oct 26, 2022, 9:59:18 AM10/26/22
to A gathering place for the Open Rail Data community
Ive seen a number of posts on here about gradient data FOIs over the years, for the likes of TRATIM or 5 Mile diagrams provided in the form of a gradient value between two mileages on an ELR.
Has anyone ever looked at extracting the elevation of the track centreline model against an accurate/availible DTM/DEM model as a option for large network gradient calculation? I can see a couple pros/cons but wonder if anyone has investigated it previously?
I can see issues with tunnels/bridges etc but the availibility of accurate (+/-15cm) elevation data nationally at a spatial resolution of 2m sounds like it has potential for a large portion of track coverage and giving a gradient value for each track and not a general value for the ELR?

Peter Hicks
Oct 26, 2022, 12:19:59 PM10/26/22
to openrail...@googlegroups.com
Hi Stuart
Is this a dataset that one might expect Network Rail would hold already?
Peter
--
You received this message because you are subscribed to the Google Groups "A gathering place for the Open Rail Data community" group.
To unsubscribe from this group and stop receiving emails from it, send an email to openraildata-t...@googlegroups.com.
To view this discussion on the web, visit https://groups.google.com/d/msgid/openraildata-talk/448a3005-efb8-49ac-bf73-40e6357b6257n%40googlegroups.com.
Stuart Gordon
Oct 26, 2022, 1:33:21 PM10/26/22
to A gathering place for the Open Rail Data community
Hi Peter,
I doubt NR would have done this work as they would typically just 'go out and measure' but interested if anyone here has looked into it previously and observered any issues as it would be a remote sensed opportunity. Alternatively im not sure if the measurement trains can measure gradient?
Digital Terrain Models/Digital Elevation Models are typically used in earth observation/remote sensing applications - think 3d view in google earth. Low resolution models are availible through the government or detailed ones are sometimes commercially restricted but they typically have a 3d flat surface model (x, y, z). However the high resolution models can have a 25cm vertical accuracy with a spatial resolution of 2m for the latest available Enviornment Agency models from 2020.
I doubt NR would have done this work as they would typically just 'go out and measure' but interested if anyone here has looked into it previously and observered any issues as it would be a remote sensed opportunity. Alternatively im not sure if the measurement trains can measure gradient?
The thoughts in my mind would be...these models can be overlaid in a GIS system and extract the z co-ordinate (terrain height) from the DEM/DTM model which can then be added as a feature in the points on the track centre line model to get a 3d centreline model that you can then use to calculate gradients for the individual track elements (assume spliting polylines up into segments). What benefit that has over tratim or other sources im not sure, for example any tunnel would not show up as it would intersect the terrain/elevation plane and bridges may or may not be accurately represented in the DEM - depends on the model I imagine.
It would be intersting to see if there was a difference, or a weighted average could say be taken off the reference track model as a best fit which I imagine would be closer to the output of the TRATIM/5 mile sources, or even could be an interesting comparision model considering how old some of the previous gradient sources are.

Legolash2o
Nov 12, 2022, 10:09:08 AM11/12/22
to A gathering place for the Open Rail Data community
I have done some work on taking TRATIM, 5-mile diagrams and Signalling Diagrams to then map the data on a track-center line model. I then also retrieved OS5, OS50, OpenElevation and Google elevation data at timings points, junctions and gradient changes as a cross-reference.
It has enabled creating tools like below to do a A to B to C routing, and retrieve the gradient profile.
Legolash2o
Nov 12, 2022, 10:14:04 AM11/12/22
to A gathering place for the Open Rail Data community
I forgot to mention that the TRATIM data is pretty good and matches the 5-mile diagrams. There's a few locations where they don't match or places such as Euston and grade separated junctions where each line has a different gradient. In these places I had to use Signalling Diagrams to map the data.

Dave H
Nov 13, 2022, 7:04:03 AM11/13/22
to openrail...@googlegroups.com
Interesting, I think that there's a number of locations where a practical & possible connection could open some capacity boost, contingency gain & cost reductions and the likely geometry constraints can be checked
I'm especially thinking of how the stub of the approach viaducts for St Enoch station (around 7m from rail level to road passing below) might drop down in available space to connect with the Argyle Line tunnels & re use 2 abandoned platforms at GLC, releasing capacity at GLC High Level 1-15 & adding 18/19 at Low Level for regulating & turn back resilience
Looks as if a 1:50 X 300-400m gradient could make the link
A steady plan to upgrade Hyndland - Finnieston with this could deliver increased capacity plus resilience for Glasgow's local network & this open data enables some evidence based independent ideas to be analysed
H
To view this discussion on the web, visit https://groups.google.com/d/msgid/openraildata-talk/fa9f10a4-cde1-4da7-8c33-61c4a145193bn%40googlegroups.com.
Stuart Gordon
Nov 14, 2022, 10:21:39 AM11/14/22
to A gathering place for the Open Rail Data community
Interesting, that routing tool is great, not just for the gradient. Suprising how useful it is purely from gradient at locations, although that might be your manual additions.
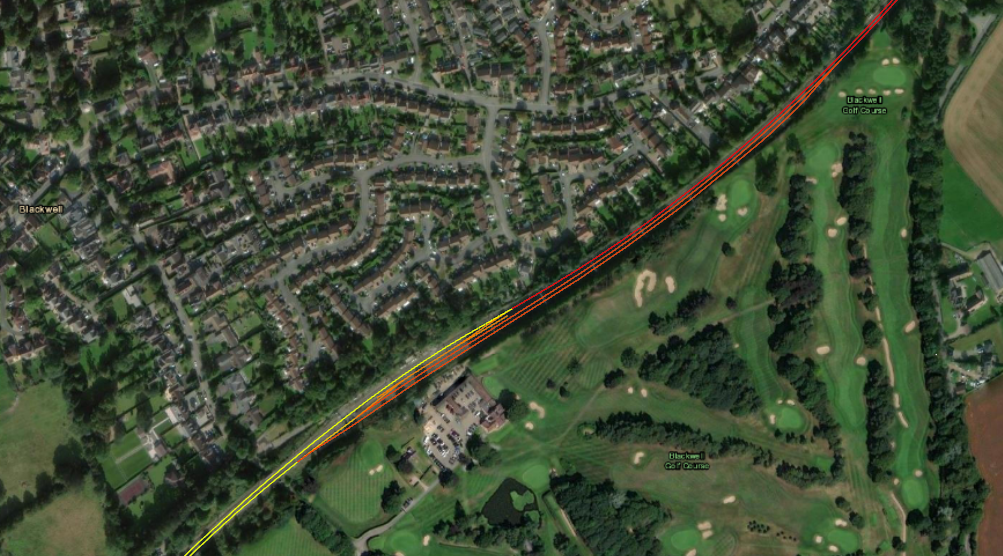
My idea is to use some of the satelite data under open gov licences such as UK LiDAR data availible at a 1m resolution, more accurate than +/- 15cm for ~90% of the UK (https://www.data.gov.uk/dataset/b1ff0a9c-74d3-4b97-a3fb-c8ab39ef6152/lidar-composite-dtm-2020-1m#licence-info)
If you take the elevation values from the lidar data and apply it to all the unique gps points on the Track Centre Line model you could calculate gradient as granular as between gps points on each line if desired (average is less than 100m), ideally this allows for calculated values for each track let alone between each geospatial point along the polylines (once you deal with things like tunnels/bridges etc)
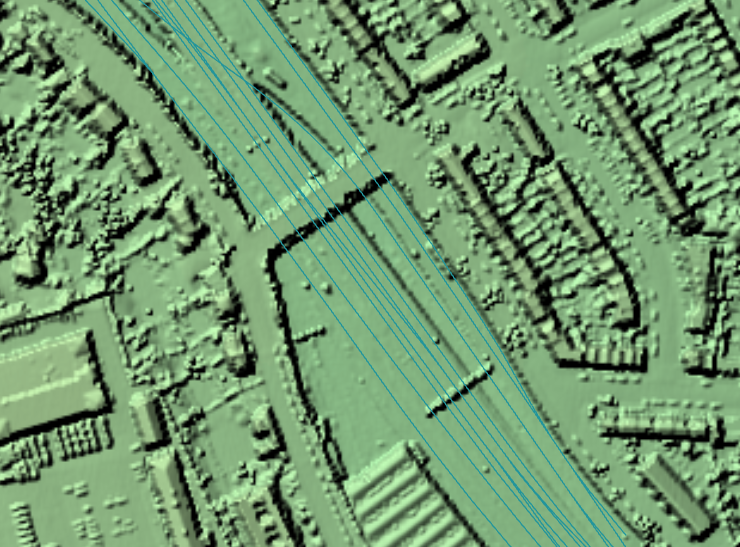
Your euston example attached, for the DTM you can see the difference in elevation between the graded junctions and interestingly you can see the signal gantrys on the DSM (resolution isnt good enough to pick up individual signal posts). Also attached shows the Lickey Incline after calculating the gradient for each polyline for each track - so it seems to work as a concept
Reply all
Reply to author
Forward
0 new messages