Sigma in SMTK
120 views
Skip to first unread message

Şafak Söylemez
Apr 17, 2021, 2:03:20 PM4/17/21
to OpenQuake Users
Dear All,
I am getting following error. How can I correct it?
I am also attaching my code.
Traceback (most recent call last):
File "sigma.py", line 45, in <module>
main()
File "sigma.py", line 41, in main
tp.plot()
File "/home/openquake/GEM/.env/py36/lib/python3.6/site-packages/smtk-0.9.0_git8f1b677-py3.6.egg/smtk/trellis/trellis_plots.py", line 499, in plot
fig = self.get_fig()
File "/home/openquake/GEM/.env/py36/lib/python3.6/site-packages/smtk-0.9.0_git8f1b677-py3.6.egg/smtk/trellis/trellis_plots.py", line 509, in get_fig
gmvs = self.get_ground_motion_values()
File "/home/openquake/GEM/.env/py36/lib/python3.6/site-packages/smtk-0.9.0_git8f1b677-py3.6.egg/smtk/trellis/trellis_plots.py", line 749, in get_ground_motion_values
[self.stddevs])
File "/home/openquake/GEM/oq-engine/openquake/hazardlib/gsim/akkar_bommer_2010.py", line 123, in get_mean_and_stddevs
C, stddev_types, num_sites=len(sites.vs30)
File "/home/openquake/GEM/oq-engine/openquake/hazardlib/gsim/akkar_bommer_2010.py", line 136, in _get_stddevs
assert stddev_type in self.DEFINED_FOR_STANDARD_DEVIATION_TYPES
AssertionError

Peter Pažák
Apr 18, 2021, 10:27:26 PM4/18/21
to OpenQuake Users
Hi, for me it works if I remove the spaces in:
stddevs =" Total "
to
stddevs ="Total"
Peter
Dátum: sobota 17. apríla 2021, čas: 20:03:20 UTC+2, odosielateľ: saf...@gmail.com
Message has been deleted
Şafak Söylemez
Apr 19, 2021, 6:00:24 AM4/19/21
to OpenQuake Users
Hi Peter,
Thank you very much for your help.
Safak
Şafak Söylemez
Apr 30, 2021, 4:44:55 AM4/30/21
to OpenQuake Users
Hi Peter and All,
How can I draw major and minor grid lines on the plots?
Safak
Peter Pažák
May 5, 2021, 9:12:21 AM5/5/21
to OpenQuake Users
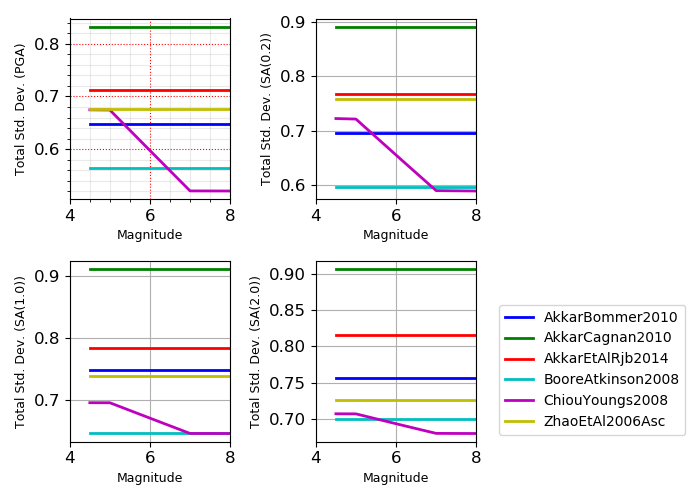
Hi, in fact I get the major gridlines in the result, you do not see them?
I am able to manipulate the figure in the following way: first get the figure by get_fig, then manipulate it and save another png (the
stdev.png and new.png will be saved...)
import numpy as np
import smtk.trellis.trellis_plots as trpl
gmpe_list = ["AkkarBommer2010", "AkkarCagnan2010", "AkkarEtAlRjb2014", "BooreAtkinson2008", "ChiouYoungs2008", "ZhaoEtAl2006Asc"]
imts = ["PGA", "SA(0.2)", "SA(1.0)", "SA(2.0)"]
params = {"ztor": 5.0, # Topofrupturedepth
"hypo_depth": 10.0, # Hypocentraldepth
"vs30": 800.0, # Vs30forallsites
"vs30measured": True, # Vs30valueismeasured
"z1pt0": 100.0, # Depth(m)tothe1.0km/sVsinterface
"dip": 90.0, # VerticalFault
"rake": 0.0 # Strike-slipfault
}
magnitudes = np.arange(4.5, 8.1, 0.1)
distances = {"repi": 20.0, "rhypo": 22.5, "rjb": 15.0, "rrup": 16.0, "rx": 15.0}
#tp.plot()
tp = trpl.MagnitudeSigmaIMTTrellis(magnitudes, distances, gmpe_list, imts, params, stddevs ="Total", figure_size=(7, 5), filename="stdev", legend_fontsize = 10, filetype="png")
fig = tp.get_fig()
fig.axes[0].grid(which='major',color='r', linestyle=':')
fig.axes[0].minorticks_on()
fig.axes[0].grid(b=True, which='minor', color='#999999', linestyle='-', alpha=0.2)
fig.savefig('new.png')
axes[0] is for the first of the 4 subplots you get in the trellis plot.
Peter
Dátum: piatok 30. apríla 2021, čas: 10:44:55 UTC+2, odosielateľ: saf...@gmail.com
Şafak Söylemez
May 19, 2021, 12:41:31 PM5/19/21
to OpenQuake Users
Thank you very much Peter.
Reply all
Reply to author
Forward
0 new messages