Use Values From Cells as Data Labels for Scatter Chart
836 views
Skip to first unread message

sza...@illinois.edu
Jan 22, 2019, 12:34:39 PM1/22/19
to openpyxl-users
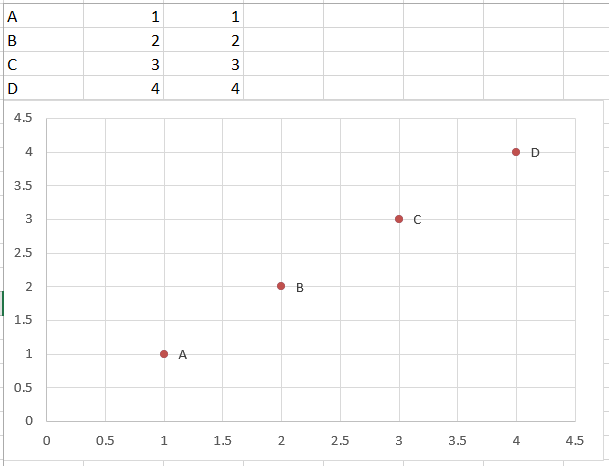
I would like to use values from another cell to add data labels to a ScatterChart in openpyxl. Basically, this is what I would like to accomplish:I am not sure which args to provide to DataLabel to reference the cells or otherwise specify the label...
Is this possible in openpyxl? If so, how would I do this? I looked at the source code/docs and they were not particularly helpful when it came to this use-case. This is what I have so far:
labels = Reference(...) series = Series(ys, xs, title='data') series.labels = DataLabelList([DataLabel(idx=idx) for idx, lbl in enumerate(labels.cells)])
Charlie Clark
Jan 23, 2019, 4:03:22 AM1/23/19
to openpyx...@googlegroups.com
specification. There is simply too much to cover in the openpyxl
documentation, or at least that I can do in my spare time, but the API is
more or less exactly that of the official specification.
Normally, armed with this and some reverse engineering of the XML that
Excel produces is sufficient for most problems. Additions to the
documentation are, however, always appreciated.
Charlie
--
Charlie Clark
Managing Director
Clark Consulting & Research
German Office
Kronenstr. 27a
Düsseldorf
D- 40217
Tel: +49-211-600-3657
Mobile: +49-178-782-6226

win...@gmail.com
Jan 23, 2019, 1:00:56 PM1/23/19
to openpyxl-users
Alright, upon reverse-engineering the OOXML generated by Excel, I found that the DataLabel format is generated as follows:
How do I generate this datalabelsRange structure in openpyxl? It isn't in the docs, and I don't see a way to generate a custom structure like this either.
<c:dLbl> <c:idx val="0" /> <c:layout /> <c:tx> <c:rich> <a:bodyPr /> <a:lstStyle /> <a:p> <a:fld id="{5D592397-7022-4963-9D53-802D0D2DAAF4}" type="CELLRANGE"> <a:rPr lang="en-US" /> <a:pPr /> <a:t>[CELLRANGE]</a:t> </a:fld> <a:endParaRPr lang="en-US" /> </a:p> </c:rich> </c:tx> ...</c:dLbl>And, with some additions to my code, I attempted to replicating that as follows:
<dLbl> <idx val="0" /> <txPr> <a:bodyPr xmlns:a="http://schemas.openxmlformats.org/drawingml/2006/main" /> <a:p xmlns:a="http://schemas.openxmlformats.org/drawingml/2006/main"> <a:r> <a:t /> </a:r> <fld id="{f73f9bbb-e9fd-42a9-aaa0-80a420ab07a9}" t="[CELLRANGE]" type="CELLRANGE" /> </a:p> </txPr></dLbl>So, one immediate problem is that I cannot generate the <c:tx><c:rich>... structure, but I think that should be OK?
The next problem is that these dLbls don't actually directly reference the cells themselves -- instead the references are part of the series's extList as follows:
... <c:extLst> <c:ext xmlns:c15="http://schemas.microsoft.com/office/drawing/2012/chart" uri="{02D57815-91ED-43cb-92C2-25804820EDAC}"> <c15:datalabelsRange> <c15:f>Sheet1!$A$1:$A$5</c15:f> <c15:dlblRangeCache> ... </c15:dlblRangeCache> </c15:datalabelsRange> </c:ext> </c:extLst></c:ser>Charlie Clark
Jan 23, 2019, 2:03:24 PM1/23/19
to openpyx...@googlegroups.com
format which isn't essential and which we don't support.
> The next problem is that these dLbls don't actually directly reference
> the
> cells themselves -- instead the references are part of the series's
> extList
> as follows:
> ...
> <c:extLst>
> <c:ext
> xmlns:c15="http://schemas.microsoft.com/office/drawing/2012/chart"
> uri="{02D57815-91ED-43cb-92C2-25804820EDAC}">
> <c15:datalabelsRange>
> <c15:f>Sheet1!$A$1:$A$5</c15:f>
> <c15:dlblRangeCache>
> ...
> </c15:dlblRangeCache>
> </c15:datalabelsRange>
> </c:ext>
> </c:extLst>
> </c:ser>
> How do I generate this datalabelsRange structure in openpyxl? It isn't in
> the docs, and I don't see a way to generate a custom structure like this
> either.
them. Looking at the specification you should be able to orientate
yourself at how chart titles handle either text or cell references.

gao...@gmail.com
Apr 22, 2019, 12:26:52 PM4/22/19
to openpyxl-users
Just curious how do you export the xml file from Excel?
I am new to xml and from what I have learned, I will need an xml mapping to export a xml file and I am not sure how could I get this xml mapping.
And by the way I am also trying to implement the feature of adding labels by 'value from cell' into the graph by using openpyxl. Would love to know if you succeeded in this.
Thanks!
Charlie Clark
Apr 23, 2019, 4:31:53 AM4/23/19
to openpyx...@googlegroups.com
Am .04.2019, 18:26 Uhr, schrieb <gao...@gmail.com>:
> Just curious how do you export the xml file from Excel?
You don't, the file format is a zipfile containing XML files.
> Just curious how do you export the xml file from Excel?
> I am new to xml and from what I have learned, I will need an xml mapping
> to export a xml file and I am not sure how could I get this xml mapping.
>
> And by the way I am also trying to implement the feature of adding labels
> by 'value from cell' into the graph by using openpyxl. Would love to know
> if you succeeded in this.
win...@gmail.com
Apr 23, 2019, 9:25:22 PM4/23/19
to openpyxl-users
And by the way I am also trying to implement the feature of adding labels by 'value from cell' into the graph by using openpyxl. Would love to know if you succeeded in this.
I ended up giving up on this, and using another plotting tool.
gao...@gmail.com
Apr 30, 2019, 1:12:08 PM4/30/19
to openpyxl-users
Got it. Thanks!
gao...@gmail.com
Apr 30, 2019, 1:12:50 PM4/30/19
to openpyxl-users
Yeah, me as well... Thanks!
Alan Perez
Mar 21, 2023, 5:09:55 PM3/21/23
to openpyxl-users
I'm struggling with the same thing. Which plotting tool did you end up using?
Justin Szaday
Mar 21, 2023, 8:03:14 PM3/21/23
to openpyx...@googlegroups.com
Unfortunately, this was for a project at a past employer, and I no longer recall the alternative I switched to. I vaguely recollect using xlsxwriter.readthedocs.io, but I can't be certain.
--
You received this message because you are subscribed to a topic in the Google Groups "openpyxl-users" group.
To unsubscribe from this topic, visit https://groups.google.com/d/topic/openpyxl-users/KJ-BwlrFYbg/unsubscribe.
To unsubscribe from this group and all its topics, send an email to openpyxl-user...@googlegroups.com.
To view this discussion on the web, visit https://groups.google.com/d/msgid/openpyxl-users/0df455bf-d396-46f1-8bc5-2564779c7217n%40googlegroups.com.
Justin Szaday
Reply all
Reply to author
Forward
0 new messages