learn visualization [WAS Possible erroneous behavior of BindLink]
44 views
Skip to first unread message

Ivan V.
Mar 5, 2022, 1:00:31 AM3/5/22
to opencog
Hi Linas,
Linas wrote:
> And, while I have your attention, something completely off-topic, but: in the https://github.com/opencog/learn
project I have large datasets with interesting info in them. I have
plenty of ways of seeing this myself, but I can't think of any easy way
to expose what I see to other people. One of the datasets shows
relationships between tens of thousands of words, and I'm wondering: how
can I open this up to some interactive web query or browser or chat,
here you might ask "find similar words" or ... I dunno I'm not even sure
how to explain it. The project is going very well, I'm getting good
results, but I can't figure out how to make it exciting for anyone else
but me...
If it is only tens of thousands of nodes, I believe they can be successfully loaded into a web browser on a faster computer (in between 30 second or so to load, depending on how heavy javascript post-processing is). Maybe it would be a good idea to break intro examples to a few fast-loading ones just to get visitor attention, and a few heavier ones, once that you get the visitor attention.
Some obvious technical questions I can think of are:
- Do you have any specific data examples?
- What data structures are you interested in?
- What kind of query language can be used to extract those structures?
- How close those structures are to s-expressions?
All well,
- ivan -

Linas Vepstas
Mar 5, 2022, 2:36:01 PM3/5/22
to opencog
Hi,
On Sat, Mar 5, 2022 at 12:00 AM Ivan V. <ivan....@gmail.com> wrote:
Hi Linas,Linas wrote:> And, while I have your attention, something completely off-topic, but: in the https://github.com/opencog/learn project I have large datasets with interesting info in them. I have plenty of ways of seeing this myself, but I can't think of any easy way to expose what I see to other people. One of the datasets shows relationships between tens of thousands of words, and I'm wondering: how can I open this up to some interactive web query or browser or chat, here you might ask "find similar words" or ... I dunno I'm not even sure how to explain it. The project is going very well, I'm getting good results, but I can't figure out how to make it exciting for anyone else but me...If it is only tens of thousands of nodes, I believe they can be successfully loaded into a web browser on a faster computer (in between 30 second or so to load, depending on how heavy javascript post-processing is). Maybe it would be a good idea to break intro examples to a few fast-loading ones just to get visitor attention, and a few heavier ones, once that you get the visitor attention.
Unfortunately, no. The data sets mostly all have ten to 20 thousand words in the English language; but to describe the various relationships between these words requires millions of atoms. The smallest datasets have maybe only 1 or 2 million atoms; usually, they have 10 to 20 million.
Some obvious technical questions I can think of are:
- Do you have any specific data examples?
I have many hundreds of datasets... varying content, varying quality, varying parameters.
- What data structures are you interested in?
Well, there's a big difference between "what I am interested in" and "what might be impressive to curious onlookers". What I am interested in is well-taken care of: I have a huge assortment of scripts and tools to view and extract what I'm interested in. So that's not the problem.
The problem is this: I feel like I'm making good progress, getting great results, but I don't know how to communicate that in a way that anyone else can see. That includes people like Ben, but also people like yourself: there is the "usual band of suspects" -- the people reading this email, maybe a dozen past participants, maybe another dozen onlookers. What can be demoed that might catch their attention, their imagination?
- What kind of query language can be used to extract those structures?
I've got a large variety of tools. All of them wrap the query engine in some way, hiding the low-level details.
The issue is that "those structures" are themselves made out of thousands or tens of thousands of atoms at a time, so its like "here's a blob of a thousand atoms, look at how it relates to that one over there" -- where each blob represents a single word of the English language.
A long long time ago, there was an opencog chatbot, and people did enjoy connecting to it and fooling around with it. I wish I could do that again, but the current datasets are not capable of supporting chat. At this time, the most you can ask for is for relationships between various words, for statistics about them. Well, and phrases, too, but that is a bit rockier, right now.
- How close those structures are to s-expressions?
Everything in the atomspace is an s-expression.... but you know this, of course. But atoms are very low-level. It is the assemblage of atoms, the network that matters. How they attach to one-another. That's where the intelligence lies.
-- Linas
All well,- ivan -
--
You received this message because you are subscribed to the Google Groups "opencog" group.
To unsubscribe from this group and stop receiving emails from it, send an email to opencog+u...@googlegroups.com.
To view this discussion on the web visit https://groups.google.com/d/msgid/opencog/CAB5%3Dj6V1wjTSy-n552MzXaBQTGKrcEETTa%2B6EzAx%2BVhymA6JHw%40mail.gmail.com.
--
Patrick: Are they laughing at us?
Sponge Bob: No, Patrick, they are laughing next to us.
Ivan V.
Mar 5, 2022, 4:08:21 PM3/5/22
to opencog
Hi,
Javascript *could* manage millions of data particles, but I suspect they have to be stored as a single low-level ByteArray, not to bloat javascript variables and structured array space.
If you are eager to use C, there are some tools (I think one of them called emscripten) that compile C++ code to Webassembly to be run inside a browser. I've seen screenshots of an old 3D Doom game from 90-es and other graphical C++ DOS apps running happily inside a browser, I think even a DOS emulator that supports graphic modes. The whole thing should achieve only 2x slowdown (as they measured) compared to native running in dos box. The point is - the most of what you can run natively, you can run inside a browser with merely 2x slowdown. The only bottleneck would be an Internet connection bandwidth. Personally, I don't have any experience with emscripten, but I guess it shouldn't be too complicated to get it running. It should be only a matter of recompiling existing C++ code.
But to return to javascript - although millions of atoms could be theoretically efficiently stored in a single bytearray, Internet connection bandwidth could be a problem because maybe we are talking about hundreds of megabytes. The logical step would be to prepare a CogServer instance filled with those millions of atoms, keep it always running, and then query only what is of the current interest to forward it to a browser. Anyway, who would browse over millions of atoms all at once? One might only be interested in some subset of it, and if that subset can be measured in thousands of atoms, I think javascript should be able to grock it (I tested CogProtoLab on ten thousand lines from your web site, the thing loaded in about 20 seconds on my celeron, but I think I could make it faster if necessary). Then CogServer could be queried by php to extract only what is of the current interest, then AJAX it to a client browser. The only remaining question would be what do we want to show, and how do we want to show it.
Do you have any basic glimpse of a kind of visualization you'd like to have? And what user interactions would pair it to be successful?
- ivan -
To view this discussion on the web visit https://groups.google.com/d/msgid/opencog/CAHrUA36KSBL4jYb%3DPtbvSHfbYD5Gt%2BE%2B7s89JR1Ay6jawth7Zg%40mail.gmail.com.
Ivan V.
Mar 5, 2022, 5:58:28 PM3/5/22
to opencog
Linas,
Could you describe in a paragraph or two, what are you exactly dealing with?
- ivan -
Linas Vepstas
Mar 6, 2022, 2:30:32 PM3/6/22
to opencog
On Sat, Mar 5, 2022 at 3:08 PM Ivan V. <ivan....@gmail.com> wrote:
The logical step would be to prepare a CogServer instance filled with those millions of atoms, keep it always running, and then query only what is of the current interest to forward it to a browser.
Yes, exactly.
Anyway, who would browse over millions of atoms all at once? One might only be interested in some subset of it, and if that subset can be measured in thousands of atoms,
Or even just hundreds. Or dozens.
Do you have any basic glimpse of a kind of visualization you'd like to have? And what user interactions would pair it to be successful?
That's the hard question. It's hard to find good answers. I need your help finding good answers. Here are some ideas. For example, given one word, find all the other words "related" to it. Order the list by the strength-of-relationship (and maybe show only the top-20). There are various different ways of defining "relatedness". One is to ask for all words that occur nearby, in "typical" text. So, for example, if you ask about "bicycle", you might get back "bicycle wheel", "bicycle seat", "ride bicycle", "own bicycle". Another might be to ask for "similar" words, you might get back "car", "horse", "bus", "motorcycle". A third query would return skip-gram-like "disjuncts", of the form "ride * bicycle to *" or "* was on * bicycle" or "* travelled by bicycle * on foot" -- stuff like that. These are all fairly low-level relationships between words, and are the kind of datasets I have right now, today.
My long-term goal, vision is to create a complex sophisticated network of information. Given that network, how can it be visualized, how can it be queried? A classic answer would be a school-child homework assignment: "write 5 sentences about bicycles". This would be a random walk through the knowledge network, converting that random walk into grammatically correct sentences (we're talking about how to do this in link-grammar, in a different email thread. It's hard.)
Is there a way of visualizing this kind of random walk? Showing the local graph of things related to bicycles?
So the meta-problem is: given a network of knowledge, how does one interact with it? How does one visualize it? How does one make it do things? If I pluck the word "bicycle" like a guitar string, how can I hear, see the vibrations of the network?
-- Linas
Ivan V.
Mar 7, 2022, 7:49:39 AM3/7/22
to opencog
Linas,
I'm giving it a thought...
For words similar to other words, or words near other words, directed cyclic graphs with a few thousands unique nodes (spanning infinitely because they are cyclic) seem the most promising food for thought. If you could make CogServer (or analogous app) to output the node-relations set, I could try to show them in a browser. Probably, additional search-for-word feature would appy along the already seen browsing by dragging nodes around to navigate them.
For skip-gram disjunct queries, I'm not completely sure how their output data is interrelated. But if you can make the queries output parent-children data, the rest would be easy.
--
You received this message because you are subscribed to the Google Groups "opencog" group.
To unsubscribe from this group and stop receiving emails from it, send an email to opencog+u...@googlegroups.com.
To view this discussion on the web visit https://groups.google.com/d/msgid/opencog/CAHrUA37FQRCq0Sj_iiJ5bch-D6Fi4VOkrLS_SMcFy3q_B6DMqw%40mail.gmail.com.
Linas Vepstas
Mar 9, 2022, 12:05:15 AM3/9/22
to opencog, Anton Kolonin
Hi Ivan,
On Mon, Mar 7, 2022 at 6:49 AM Ivan V. <ivan....@gmail.com> wrote:
Linas,I'm giving it a thought...For words similar to other words, or words near other words, directed cyclic graphs with a few thousands unique nodes (spanning infinitely because they are cyclic) seem the most promising food for thought. If you could make CogServer (or analogous app) to output the node-relations set, I could try to show them in a browser. Probably, additional search-for-word feature would appy along the already seen browsing by dragging nodes around to navigate them.
I could set this up. It would be the standard cogserver. I'm paranoid about being hacked, so I would set it up somewhere "secret" where only you can get to it. The API would be that you give it a word, and get back a list of edges attached to that word. Each edge has a weight. At the far end of the edge is another word. I can give you either the "raw API" as I use it, or I can write some easy-to-use wrappers for it. The raw API looks like this:
; Some initial setup, "magic incantations"
(define star-obj (foo bar baz))
; Get a list of all "left"-connected atoms
(define atom-list (star-obj 'left-stars (Word "bicycle")))
; The above returns a scheme list. To get the weight, you would say
(define some-atom (list-ref atom-list 42)) ; get the 42nd atom
; get the third floating point number attached at "whizbang"
(cog-value-ref (cog-get-value some-atom (Predicate "key to whiz bang")) 3)
That's it. The atom-list will be either a list of WordNodes or a list or WordClassNodes, or other atoms, it depends. We can keep it simple, or general ...
The value system hangs lists of floating point numbers on atoms. The (Predicate "key to whiz bang") is just the key to some specific list of numbers. Not all atoms have all keys; this is all very data-set-specific.
As I said, I can wrap up the above in an even simpler API.
For skip-gram disjunct queries, I'm not completely sure how their output data is interrelated. But if you can make the queries output parent-children data, the rest would be easy.
Disjuncts are just atoms.
Consider the sentence "Ivan threw the ball". The disjunct for the verb "threw" is conceptually: "threw: ivan- & ball+" which says that Ivan is on the left and ball is on the right. Written in Atomese, it is this a rather verbose tree:
(Section (Word "throw")
(ConnectorList
(Connector (Word "Ivan") (ConnectorDir "-"))
(Connector (Word "ball") (ConnectorDir "+")) ))
which is painfully verbose ... the "conceptual" version is much easier to understand. (and read)
Anyway, the above will have various keys on it, holding the count, the log probability, assorted other numbers that are "interesting".
The query for the above would be the same as before, except that you would get back a list of these Sections.
If you are interested & ready to do this, let me know. It would take me a few days to set it up.
- ivan ---ned, 6. ožu 2022. u 20:30 Linas Vepstas <linasv...@gmail.com> napisao je:--On Sat, Mar 5, 2022 at 3:08 PM Ivan V. <ivan....@gmail.com> wrote:The logical step would be to prepare a CogServer instance filled with those millions of atoms, keep it always running, and then query only what is of the current interest to forward it to a browser.Yes, exactly.Anyway, who would browse over millions of atoms all at once? One might only be interested in some subset of it, and if that subset can be measured in thousands of atoms,Or even just hundreds. Or dozens.Do you have any basic glimpse of a kind of visualization you'd like to have? And what user interactions would pair it to be successful?That's the hard question. It's hard to find good answers. I need your help finding good answers. Here are some ideas. For example, given one word, find all the other words "related" to it. Order the list by the strength-of-relationship (and maybe show only the top-20). There are various different ways of defining "relatedness". One is to ask for all words that occur nearby, in "typical" text. So, for example, if you ask about "bicycle", you might get back "bicycle wheel", "bicycle seat", "ride bicycle", "own bicycle". Another might be to ask for "similar" words, you might get back "car", "horse", "bus", "motorcycle". A third query would return skip-gram-like "disjuncts", of the form "ride * bicycle to *" or "* was on * bicycle" or "* travelled by bicycle * on foot" -- stuff like that. These are all fairly low-level relationships between words, and are the kind of datasets I have right now, today.My long-term goal, vision is to create a complex sophisticated network of information. Given that network, how can it be visualized, how can it be queried? A classic answer would be a school-child homework assignment: "write 5 sentences about bicycles". This would be a random walk through the knowledge network, converting that random walk into grammatically correct sentences (we're talking about how to do this in link-grammar, in a different email thread. It's hard.)Is there a way of visualizing this kind of random walk? Showing the local graph of things related to bicycles?So the meta-problem is: given a network of knowledge, how does one interact with it? How does one visualize it? How does one make it do things? If I pluck the word "bicycle" like a guitar string, how can I hear, see the vibrations of the network?-- Linas
You received this message because you are subscribed to the Google Groups "opencog" group.
To unsubscribe from this group and stop receiving emails from it, send an email to opencog+u...@googlegroups.com.
To view this discussion on the web visit https://groups.google.com/d/msgid/opencog/CAHrUA37FQRCq0Sj_iiJ5bch-D6Fi4VOkrLS_SMcFy3q_B6DMqw%40mail.gmail.com.
You received this message because you are subscribed to the Google Groups "opencog" group.
To unsubscribe from this group and stop receiving emails from it, send an email to opencog+u...@googlegroups.com.
To view this discussion on the web visit https://groups.google.com/d/msgid/opencog/CAB5%3Dj6U4Qs9EqPfnyKvbSr3xgXbXqDesdbjJN7rogO8YxU2ncw%40mail.gmail.com.
Ivan V.
Mar 9, 2022, 1:04:40 AM3/9/22
to opencog
Ok, I'm interested.
To view this discussion on the web visit https://groups.google.com/d/msgid/opencog/CAHrUA359jzC%3Dpg7DRVpguQnGdUhAXwda_%3D0thwmEaY%3DuX2s1FQ%40mail.gmail.com.
Linas Vepstas
Mar 20, 2022, 7:51:47 PM3/20/22
to opencog, Ivan Vodišek
Forwarding to the mailing list.
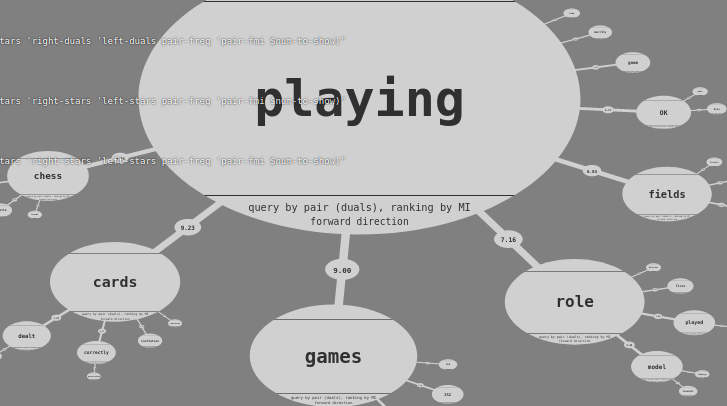
Ivan and I are having long conversations about how to visualize complex datasets. We've had some good (excellent) progress with simple datasets, but are stalled with one that have a more complex structure. I hope to put a demo on-line in a few weeks. Attached is a screenshot of the prototype. The dataset itself is pretty basic, but still, its fun ... Ivan did all of the coding work. I'm providing datasets.
---------- Forwarded message ---------
From: Linas Vepstas <linasv...@gmail.com>
Date: Sun, Mar 20, 2022 at 6:38 PM
Subject: Re: Private reply Re: [opencog-dev] learn visualization [WAS Possible erroneous behavior of BindLink]
To: Ivan V. <ivan....@gmail.com>
From: Linas Vepstas <linasv...@gmail.com>
Date: Sun, Mar 20, 2022 at 6:38 PM
Subject: Re: Private reply Re: [opencog-dev] learn visualization [WAS Possible erroneous behavior of BindLink]
To: Ivan V. <ivan....@gmail.com>
I feel like I am mail-bombing you, but also, I feel I owe you a good reply. So, philosophy ahead....
On Sat, Mar 19, 2022 at 7:04 PM Ivan V. <ivan....@gmail.com> wrote:
And now, time for some theory: when two words have many ConnectorSet "in common", they are judged to be "similar". There are several different ways to define "in common": jaccard similarity, cosine distance, mutual information, several others.Ok.That is, given a word, the collection of all of the ConnectorSeq's on that word can be thought of as being a vector, and so one can take vector products of all kinds.Ok, but do we have a use for such vector products?
I do. Writing the vector dot product as v.w (vector v dot-product vector w) one then has:
the cosine distance = v.w / |v||w|
which is popular, but turns out to be low-quality.
the (fractional) mutual information MI = log v.w / v.* w.*
the variational MI = log v.w / sqrt v.* w.*
both of which work much better than the cosine.
A visualization challenge is then: how can one compare vectors? How can one visualize the vectors? How can one visualize their similarities?I don't know if this can help, but... Vectors have a set of values in different dimensions, right?
Perhaps a practical example.
dog == fur + legs + tail + eyes + pet
cat == fur + legs + tail + eyes + pet
horse == fur + legs + tail + eyes + big
worm == round + long + underground
These are vectors. I wrote an implicit 1.0 for the relevant dimensions, and 0.0 for the missing dimensions. So, in greater detail:
vector dog == 1.0 * fur + 1.0 * legs + 1.0* tail + 1.0 * eyes + 1.0 * pet + 0.0 * round + 0.0 * underground
Clearly, cats and dogs are very similar (you can compute the cosine product ... or the MI or the VMI, they will all tell you that they are similar.)
Clearly horses and dogs are sort-of similar, and clearly the dot product of worm and dog is zero.
vectors are imperfect for common-sense reasoning, but they are fast and practical, and you can use them in many many places.
Jaccard distance is great, too.
The bubbles system can also be interpreted as a possibly infinite set of dimensions. Top bubble may represent the zeroth dimension. Bubbles orbiting the top bubble may represent the first dimension. Bubbles orbiting bubbles orbiting the top bubble may represent the second dimension, and so on.
How can I show that dog & cat are similar? well, today, the following works (almost works, the dataset is missing dog and cat):
(sim-vmi-nav 'edge-score (Word "dog") (WordNode "cat"))
This returns one floating point number. But that number is just the vmi, built from the dot-product of vectors.
How can the vector for dog, cat be visualized, and how can it be done to show that they are very similar?
But a system of dimensions is useful only to show magnitudes of each dimension. So, how to relate different dimensions regardless of what values they hold? I feel that vector products lay beneath of what you are searching for, not above. Once you figure out the above thing, you may be in position to compare those aboves using vectors.
Yes, I am trying to bootstrap my way up. There are lots of vectors, everywhere, at different layers of abstraction. Some are "below", some are "above", depending on the layer.
And what is that above? Simply, a programming language. It may be a general Turing machine, but it is hard to reason about its programs. It may be an imperative programming language, a functional programming language, a logic programming language, category theory programming language, and all the other correspondent languages we haven't even heard about yet.
The raw data that I have are:
* millions of books
* millions of photos
* millions of sound recordings.
I know how to turn these into vectors, and get GPT-like results (but using a completely different system). I do not know how to turn these into a "programming language".
I do know about Curry-Howard correspondance: that proofs are the same things as programs. I also know that steps-of-a-proof are jigsaw-pieces, and that jigsaw-pieces are the elements of a grammar, which are composed into a language. Is it possible to call this language a "programming language"? Kind of. But it is NOT a human-friendly programming language. It's very abstract and machine-centric. Not human-centric.
Atomese is a programming language, it's human-readable and human writable, but not as nice and clean as python or java; it's not meant for humans. It's meant for machines. The vectors of ConnectorSeq are in fact short little programs that are simple elements of a language. vectors and dot products are how I compose the programs. For example, "union type" and "product type" in type theory. So, just like CaML or Haskell: each Atom is *exactly* like a type in CaML or Haskell or ConcurrentML, and combine in all the same ways. Atomese is dynamically typed, CaML and haskell are static-typed. Vectors are just ... cartesian products. Same thing as lists, in lisp, scheme.
Programming is about data structures (those structures may also hold programs that may be interpreted in a processor). Once you manage to visualize different data structures, you will get an answer to your question. But how general you want to go? Do you want to bound yourself to domain specific data structures, or to bee free with general data structures? I believe that the most general data structures are the simplest ones. Domain specific ones should be just restrictions you need to additionally define to achieve some specific useful uniformities.
Atoms are the "most general" data structures, and so your earliest visualizations are "the most correct". But visualizing a single Atom is like visualizing a single neuron. You won't understand how the brain works, if your web-browser window can only draw 5 or 10 neurons at a time.
So, the question is: how do you visualize a cortical column, which consists of about 100 neurons?
Think of a single Atom as a neuron, and a single edge as a connection between neurons. Although you draw only ten connections at a time, most of those Atoms have hundreds or thousands of edges, and (nav-obj 'forward) only returns the ten most strongest connections. The hundreds of others are ignored...
And that's just the most basic network. The disjunct network is more complex. And, yes, eash disjunct is a jigsaw-puzzle piece, which means each disjunct is a part of a grammar, that defines a "programming" language. The vector products are simple programs. How can they be visualized?
This really is like slicing up a brain, and looking at it, and trying to figure out what you're seeing...
In the beginning of this story, I mentioned a system of dimensions. But those are zeroth order structures, just like there exists zeroth order logic (propositional calculus) compared to first and higher order logic. Maybe you can try to invent a first or higher order dimensional system? Some variables, or something would apply, but how?
Already have. You need to read the various papers I've sent you about jigsaw pieces. I'm not the first -- mathematicians were writing about jigsaw pieces decades ago, and linguistics even earlier. There is a broad and deep and wide foundation for all of this stuff, its the foundations for computer science. There is no quick or easy way to learn this stuff. There's oceans of it.
Read a little bit about type theory and proof theory and curry-howard correspondence, Read about grammar and parsing. Read about category theory. There are "jigsaw pieces" in all of them ... unfortunately, they are fairly hidden, Sometimes, they're mentioned explicitly, but not all that often.
But again: visualizing one jigsaw piece (one disjunct) is like visualizing one neuron. The trick is to visualize hundreds or thousands of them, all at once.
-- linas
You can go specific, or you can go general, but once you define data structures you'd like to visualize, that means that more than 99% of work is done. And if we are talking about general dimensional systems, we already know how to visualize them. We "just" lack a definition of those possibly higher order dimensional systems.- ivan -sub, 19. ožu 2022. u 22:20 Linas Vepstas <linasv...@gmail.com> napisao je:On Sat, Mar 19, 2022 at 1:46 PM Ivan V. <ivan....@gmail.com> wrote:For visualization, the basic idea would be: every query has input and output types (say, `WordNode` or `ConnectorSet`). Queries come in pairs, branching from top to bottom. If upper query output matches lower query input, those queries can be combined and will be offered in the dropdown menu.What does this typing mean for combining `cset-stars` queries? It means that they can be combined in a flip-flop manner. We start from a `WordNode`, then combine the first query `'forward` to attain `ConnectorSet`, than combine the second query `'backward` to attain `WordNode`, then again `'forward` to attain `ConnectorSet`, and so on. How does this sound?That's not a bad idea. It certainly gives a different way of navigating. We can try it, see if it's interesting.And now, time for some theory: when two words have many ConnectorSet "in common", they are judged to be "similar". There are several different ways to define "in common": jaccard similarity, cosine distance, mutual information, several others.That is, given a word, the collection of all of the ConnectorSeq's on that word can be thought of as being a vector, and so one can take vector products of all kinds.A visualization challenge is then: how can one compare vectors? How can one visualize the vectors? How can one visualize their similarities?--linas- ivan -sub, 19. ožu 2022. u 09:14 Ivan V. <ivan....@gmail.com> napisao je:Linas,I'm very sorry, I unintentionally posted my ssh connection parameters in the `READ.me` file to GitHub.The parameters, or your keys? Without keys, no one can do anything. Maybe some people might figure out that there is some ssh server on port 224, but this is not much of a threat.ssh is secure, unless someone uses a weak password. I'll disable password logins, just to be safe.I unintentionally published just the shell command.Keys are safe, thanks God for that..The disjuncts are already in the current dataset. They are pairs, where the left dist is a word, and the right side is ConnectorSeq as described before.The question is: how do visualize this structure? I do not have any simple, easy answer to this. ... for this, I need your help. What can you do to visualiize this?I may have some ideas, but I can't manage the `make-navigator` wrapper to work on disjuncts, and I'm not versed in Scheme.In the meanwhile, I am preparing a file with word-similarities in it .. actually, all three .. words-pairs, disjuncts and word-similarities. With luck I'll have it done in 12-36 hours. The similarities will be easy to visualize.Cool, take your time...- ivan -sub, 19. ožu 2022. u 07:03 Ivan V. <ivan....@gmail.com> napisao je:Linas,I'm very sorry, I unintentionally posted my ssh connection parameters in the `READ.me` file to GitHub.The parameters, or your keys? Without keys, no one can do anything. Maybe some people might figure out that there is some ssh server on port 224, but this is not much of a threat.ssh is secure, unless someone uses a weak password. I'll disable password logins, just to be safe.I unintentionally published just the shell command.sub, 19. ožu 2022. u 04:00 Linas Vepstas <linasv...@gmail.com> napisao je:On Fri, Mar 18, 2022 at 6:55 PM Ivan V. <ivan....@gmail.com> wrote:Linas,I'm very sorry, I unintentionally posted my ssh connection parameters in the `READ.me` file to GitHub.The parameters, or your keys? Without keys, no one can do anything. Maybe some people might figure out that there is some ssh server on port 224, but this is not much of a threat.ssh is secure, unless someone uses a weak password. I'll disable password logins, just to be safe.I updated the `READ.me` immediately to exclude this information, but I guess the changes are left buried inside the GitHub repo diff tracking. I hope you still are passing only me through proxy, but if you find this as a potential threat, please update your server configuration as soon as possible. The last thing I would want is to see your server being hacked.Please forgive me.Very sorry for inconvenience,Ivansub, 19. ožu 2022. u 00:04 Ivan V. <ivan....@gmail.com> napisao je:Linas,Ok, clear enough, word-pairs it is for a start (forward and backward), configurable parameters coming next, and let's see what happens then. I may need some help with documentation.I'm interested in disjuncts too, so when you decide to do them, let me know. I may have some more free time.Fine regards,Ivanpet, 18. ožu 2022. u 23:09 Linas Vepstas <linasv...@gmail.com> napisao je:On Fri, Mar 18, 2022 at 3:27 PM Ivan V. <ivan....@gmail.com> wrote:Hi Linas,Making what work? The more specific the question, the easier it is for me to answer it ...I'm sorry, there seems to be a short circuit between us, I guess I have to be more clear, I think it is my fault.Mine as well. These things take time.Let me try again posing my question from the start. You supplied me with make-navigator object I'm trying to use. Right now, I can successfully run only query patterns like these three:
- ((make-navigator pair-stars 'right-duals 'left-duals pair-freq 'pair-fmi 10) 'forward (Word "start"))
- ((make-navigator pair-stars 'right-duals 'left-duals pair-freq 'pair-fmi 10) 'backward (Word "start"))
- ((make-navigator pair-stars 'right-duals 'left-duals pair-freq 'pair-fmi 10) 'edge-score (Word "start") (Word "end"))
The `make-navigator` is an object constructor, as in "object oriented programming". It would be more efficient if you made this only once. So for example:`(define navi (make-navigator pair-stars 'right-duals 'left-duals pair-freq 'pair-fmi 10))` and then use this object over and over:(navi 'forward (Word "start"))(navi 'backward (Word "start"))It will run a little bit faster, if you just create the object once, and re-use it. The difference is not that large, so you can do it either way, but it can make the code more readable.The user interface should contain a configuration page/penel, which allows allows all of these arguments to be configurable: pair-stars 'right-duals 'left-duals pair-freq 'pair-fmi 10So, for example, the user should be able to type in 'pair-logli instead of 'pair-fmi. Now, 'pair-logli is less interesting than 'pair-fmi, but still ... It might be fun to play with.pair-stars and pair-freq are just two objects I create when I load this dataset. It might make more sense for you to create these objects, but, for now, it's OK as-as.I have other datasets that contain word-similarities. For those datasets, the two vertexes joined by an edge are words, as before. The edge itself holds three of four different kinds of similarity scores. In those datasets, the "stars" object would have some different name -- maybe word-sim-stars. I don't care. Instead of pair-freq, you would use `word-sims` and instead of 'pair-fmi you would use any one of 3 or 4 other methods that report different kinds of similarity scores.For word-similarity, there is no difference between left-stars and right-stars (or left-duals and right-duals) and so there is no difference between forward and backward.I guess I should try to create a dataset that has both word-pairs, and also similarity scores in it. Then you would need to present the user with a menu choice of three things: (a) view raw atomspace contents, (b) view word-pair chains, or (c) view similar words.A completely different project is to visualize the disjuncts. But this is a completely different project, and so you would have to ask questions about that.This all works fine, and I already made some code out of it, but I suspected (re-reading all the previous mails, especially the 8'th mail from the top - the technical one) that you (right now) wanted in the visualization more than the above three query pattern examples.Well, the disjuncts.If the above three examples are not enough, please provide me with all the concrete examples of other queries (in the above form) you'd like to have in the visualization because I'm having trouble making them up. Other things I try in scm shell return errors.That is because this dataset only has word-pairs, and csets in it. You get errors for other things, because the dataset does not have those other things in it. The only things it has are the things explained in (pair-stars 'describe) and (cset-stars 'describe) which are almost identical, but not quite, and (pair-freq 'describe) and (cset-freq 'describe) which are completely identical, except that the second uses disjuncts, not words.But if the above three examples are all you wanted for now, then everything is clear, and I made all the trouble out of nothing.disjuncts. I think that visualizing disjuncts would be interesting.You don't have to upload into the dataset anything you didn't plan,I plan to have "everything"; just that today, I don't have high-quality word-pair similarity datasets that are small enough to fit on the server I exposed to you. It would take me a few days of hard work to create them ... but given how you talk, I guess I should do this as soon as possible.I'm just trying to find out everything you expected to have available in the first visualization iteration.I guess word-pairs is enough. I will try to create something for word-similarities.I think disjuncts are important, but they are harder.--linasThere were emails about these and those queries, what is working now, what later, what's impressive and what's common, I re-read it all several times, and I guess I got lost, probably posing questions about the wrong things and making the confusion. I hope I managed to be more concise and understandable this time. If not, I seriously have to work on my communication skills.Thank you, and sorry for misunderstandings,Ivan
--Patrick: Are they laughing at us?Sponge Bob: No, Patrick, they are laughing next to us.
--Patrick: Are they laughing at us?Sponge Bob: No, Patrick, they are laughing next to us.
--Patrick: Are they laughing at us?Sponge Bob: No, Patrick, they are laughing next to us.
--
Patrick: Are they laughing at us?
Sponge Bob: No, Patrick, they are laughing next to us.
Reply all
Reply to author
Forward
0 new messages