cpu-load testing / raspberry pi / artnet -> sACN
102 views
Skip to first unread message

Andy Streubel
Jun 20, 2013, 1:09:47 PM6/20/13
to open-l...@googlegroups.com
Hey,
another update from my side.
I got the hard- and software all set up now and started to do some tests.
I had one instance of ola running on my laptop and one instance on a raspberry pi.
On the Laptop i created four ArtNet-Output Universes and on the pi four universes with ArtNet-Inputs and sACN-Outputs. To actually send data, i created a little python script, which sends DMX-data at the highest framerate the DMX512 standard allows.
Then i captured the cpu-load while adding up the sending universes (starting at 1 and ending with 4).
It looks like every universe adds up approximately 5% in cpu-load (look at the diagram).
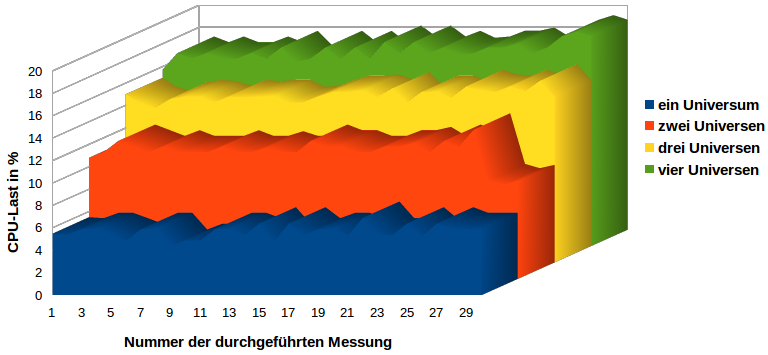
Sorry for the german in the diagram but i guess you will figure it out ;-)
Has anyone of you done some testing at the maximum value of universes the pi can handle?
Or in generally done some stress testing?
best regards
Andy

Simon Newton
Jun 20, 2013, 10:32:28 PM6/20/13
to open-lighting
On Thu, Jun 20, 2013 at 10:09 AM, Andy Streubel <andy.s...@gmail.com> wrote:
Hey,another update from my side.I got the hard- and software all set up now and started to do some tests.I had one instance of ola running on my laptop and one instance on a raspberry pi.On the Laptop i created four ArtNet-Output Universes and on the pi four universes with ArtNet-Inputs and sACN-Outputs. To actually send data, i created a little python script, which sends DMX-data at the highest framerate the DMX512 standard allows.Then i captured the cpu-load while adding up the sending universes (starting at 1 and ending with 4).
What do you use to measure cpu load? At some point the main thread won't be able to read from the socket fast enough and the UDP socket buffer will back up. You'll be able to see that with netstat.
At the last US plugfest we pointed at packet generator at the Pi. I forget what the limit was before the queues started filling up. I think it was < 10k pps.
Simon
It looks like every universe adds up approximately 5% in cpu-load (look at the diagram).
Sorry for the german in the diagram but i guess you will figure it out ;-)Has anyone of you done some testing at the maximum value of universes the pi can handle?Or in generally done some stress testing?best regards
Andy--
The Open Lighting Group: open-l...@googlegroups.com, #openlighting (irc.freenode.org)
To unsubscribe from this group, send email to open-lightin...@googlegroups.com
For more options, visit https://groups.google.com/groups/opt_out?hl=en
Andy Streubel
Jun 21, 2013, 9:18:11 AM6/21/13
to open-l...@googlegroups.com
I measured with the standard "top" program every 2 seconds and wrote the measurements to a textfile.
One thing i didn't mention before the cpu-load in the diagram is only the load for the "olad" process.
What protocol did you use at the plugfest to send the packets to the pi? Can you please explain a little more details?
Best regards
Andy Streubel
Simon Newton
Jun 21, 2013, 11:30:35 AM6/21/13
to open-lighting
On Fri, Jun 21, 2013 at 6:18 AM, Andy Streubel <andy.s...@gmail.com> wrote:
> I measured with the standard "top" program every 2 seconds and wrote the
> measurements to a textfile.
> One thing i didn't mention before the cpu-load in the diagram is only the
> load for the "olad" process.
That's only telling half the story. When looking at top, hit '1' and
> I measured with the standard "top" program every 2 seconds and wrote the
> measurements to a textfile.
> One thing i didn't mention before the cpu-load in the diagram is only the
> load for the "olad" process.
you'll see stats on cpu spent servicing interrupts as well:
On my 4 core machine:
%Cpu0 : 0.0 us, 0.0 sy, 0.0 ni,100.0 id, 0.0 wa, 0.0 hi, 0.0 si, 0.0 st
%Cpu1 : 0.0 us, 0.0 sy, 0.0 ni,100.0 id, 0.0 wa, 0.0 hi, 0.0 si, 0.0 st
%Cpu2 : 0.0 us, 0.0 sy, 0.0 ni,100.0 id, 0.0 wa, 0.0 hi, 0.0 si, 0.0 st
%Cpu3 : 0.0 us, 0.0 sy, 0.0 ni,100.0 id, 0.0 wa, 0.0 hi, 0.0 si, 0.0 st
us : user space
sy : kernel
hi: hardware interrupts
si: software interrupts
man top has more details.
> What protocol did you use at the plugfest to send the packets to the pi? Can
> you please explain a little more details?
super expensive.
Simon
>
> Best regards
> Andy Streubel
Reply all
Reply to author
Forward
0 new messages