Analysis File Vectors' Replications Query
30 views
Skip to first unread message

Ahmed Nasrallah
Sep 7, 2021, 10:17:21 AM9/7/21
to OMNeT++ Users
Hi All,
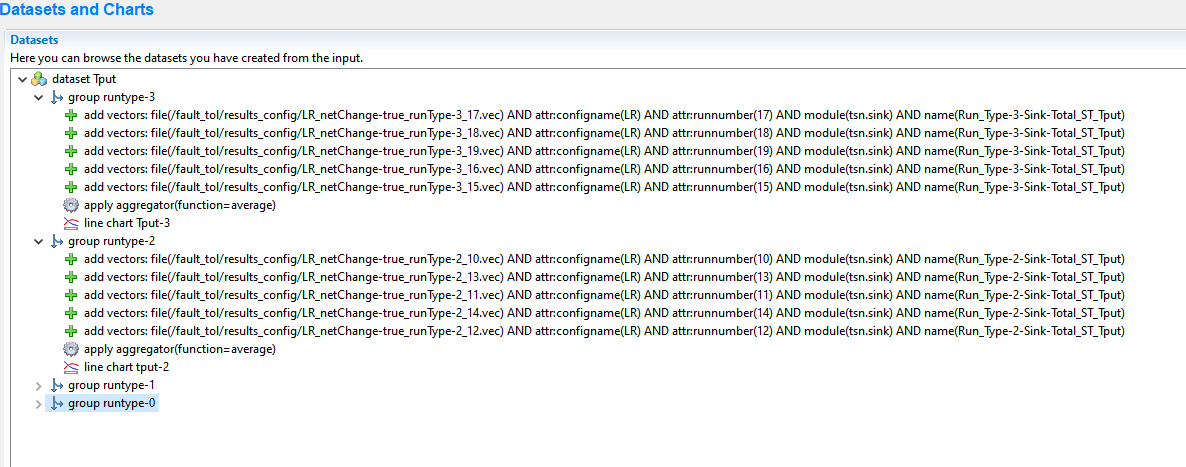
I've read Chapter 10 in the user guide in understanding the Analysis File (.anf) created with vector inputs. I have a network where I collect information stored as vectors and run the simulation with repeat (replication). I can aggregate the replication vectors and produce a chart, but the problem is I do not know how to add the charts together for each aggregated replication vectors. I've added a picture showing the dataset preview. If i remove the grouping, I get a line plot ID: aggregator(aggregator(aggregator(aggregator(<data_name>), which doesn't work.
Anyone know how to plot the charts for multiple aggregated vectors on the same chart?
Ahmed Nasrallah
Sep 21, 2021, 8:08:41 PM9/21/21
to OMNeT++ Users
If anyone is wondering, I figured out how to aggregate multiple replications and plotted them correctly. I had to add one aggregation operation and change the input grouping in the operator's properties and select "name" since it will average all vectors with the same name (since all replications will have vectors with the same name from the sim runs). Now it works correctly without any groupings.
Reply all
Reply to author
Forward
0 new messages