Stars and meta.q
26 views
Skip to first unread message

Staffan Holmqvist
Oct 24, 2022, 11:45:37 AM10/24/22
to Omics Playground
Dear helpful people,
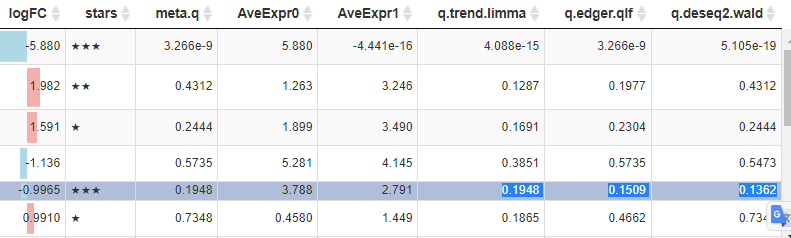
I am having trouble interpreting the stars.
According to the documentation:
" ...where meta.q for a gene represents the highest q value among the methods and the number of starts indicates how many methods have significant q values (q < 0.05)"
My data (see attached) is a contrast between two groups looking at differentially expressed genes.
First row looks correct. Meta.q shows the highest q value (q.edger.qif)
It has three stars since all of the tests show q <0.05.
For the second row. meta.q is the highest which is correct. It also shows two stars, BUT neither of the tests show q < 0.05.
If I untick the box "only show significant genes". Only rows with three stars are shown.
This includes the 5th row (in attached image). This shows three stars even though none of the test give a q < 0.05.
Could anyone explain how this makes sense?
Also meta.q is not an aggregated q? It is simply the one that was highest?
Any feedback would be much appreciated at this point.
Thanks in advance,
Friendly regards, Staffan Holmqvist. Cambridge.
Staffan Holmqvist
Oct 26, 2022, 10:07:14 AM10/26/22
to Omics Playground
Figured this one out. FDR sets the threshold for what q-level each individual test needs to be to "be assigned a star".
/S
Reply all
Reply to author
Forward
0 new messages