Issues with frequency measurements
78 views
Skip to first unread message

Warren James
Oct 18, 2012, 7:09:59 AM10/18/12
to nonoli...@googlegroups.com
I have recently relieved my CEE just yesterday. I immediately got it out and hooked up to an Audio Tone Generator to test its capabilities with a basic Sine Wave.
I was firstly a little disappointed that there was no negative swing on the voltage reading - a very basic feature to be left out even on an initial design of something essentially replicating an Oscilloscope in my opinion.
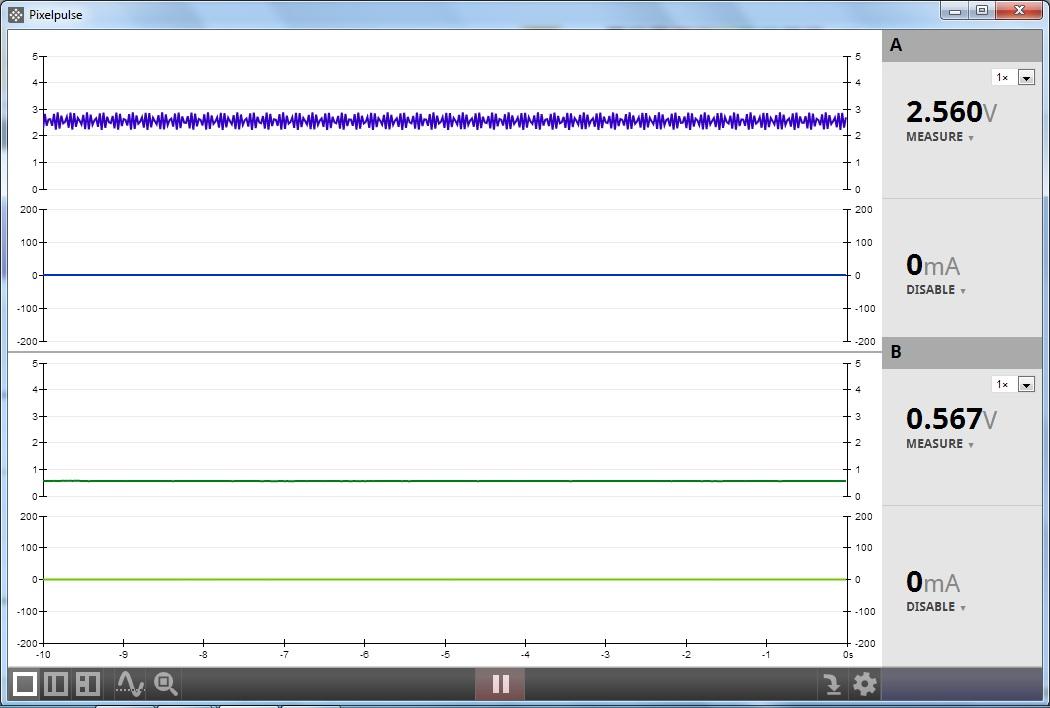
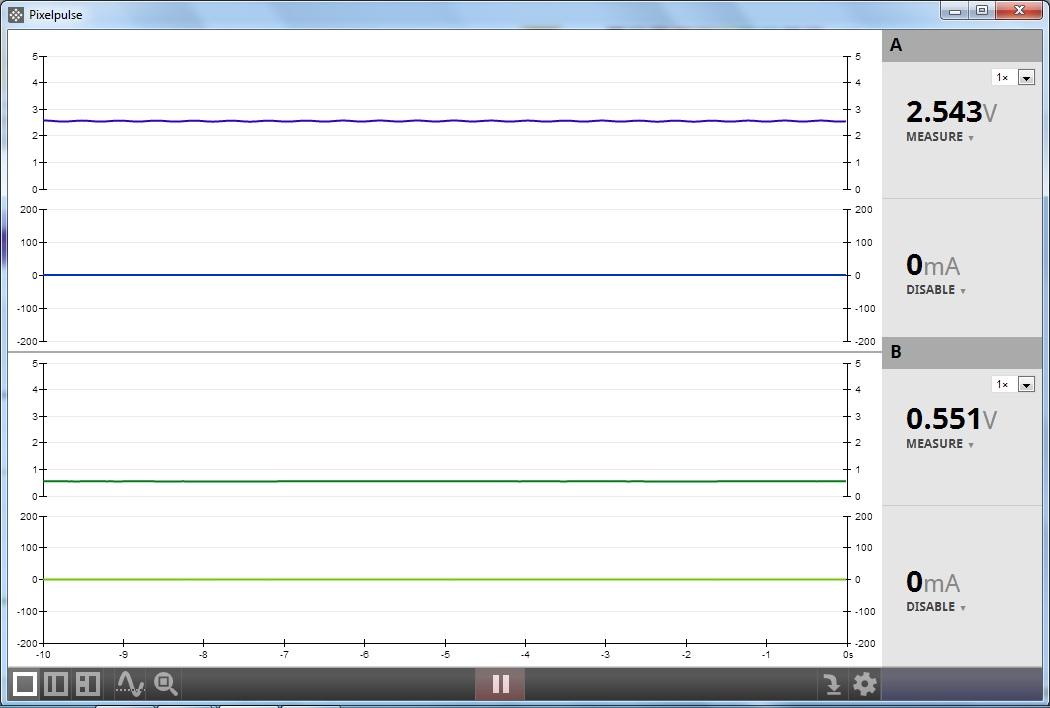
However I could see that the signal was there and somewhere around the correct shape at least - although this was only possible in the triggered mode. To rectify this I added 2.5V DC to the input so that my whole signal was visible - I used a 64Hz wave and the image in the trigger screen attachment was the result.
My first question is whats going on on the main screen - when I let the cee free run the signal is pretty much meaningless - at least I can't understand whats going on. Also I would have expected at least the Voltage levels to be the same which they are not.
I've checked the signal going in using an Oscilloscope and my source is perfect (apart from a very slight harmonic).
At this point I wasn't too concerned - at least I am getting a waveform that is close to what I expect.
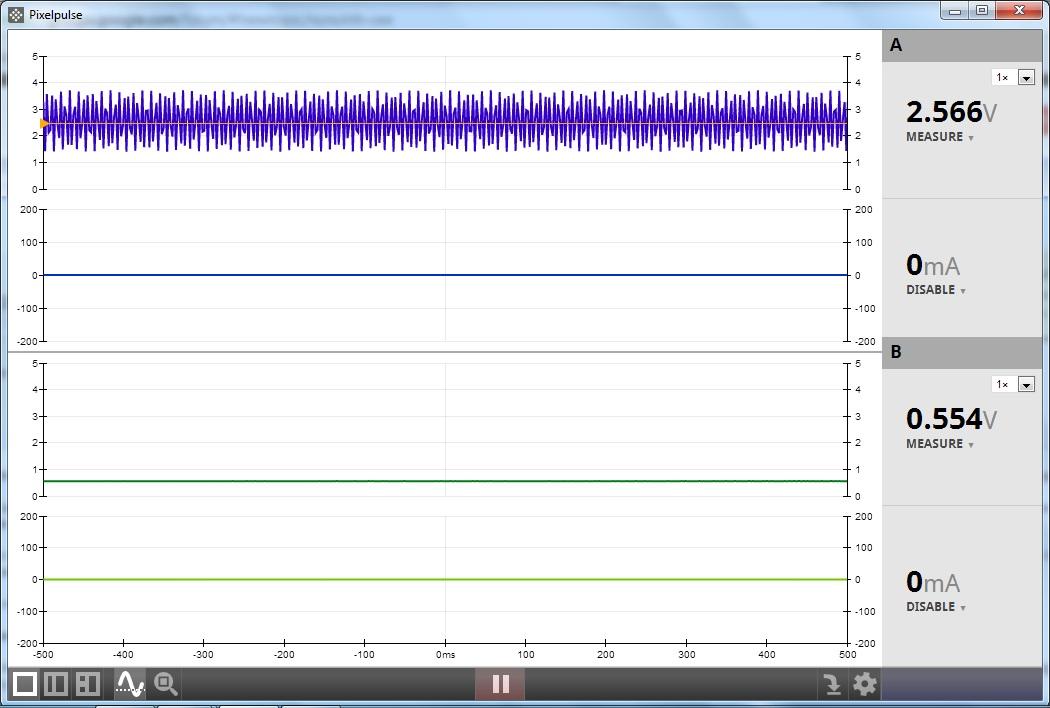
I then started to increase my frequency (btw my sample rate is set to 80k). I set my frequency to 180Hz - a frequency I am sure the cee should be capable of handling and there should be no aliasing due to the high sample frequency. The result was the attached file 180Hz.jpg. The main screen showed the file 180Hz - MainScreen.jpg.
I don't understand whats happening - is the cee faulty? Is this something I am doing?
So far the cee has been disappointing if I'm honest. It cost me a far amount after having to ship it to the UK and pay extra duty and all the rest the government sting us Brits for!
I do however want to be as positive as I can be and say that I think the whole concept is brilliant and I hope that the issues I have a just me being a fool or at worst just teething issues of a project that appears to be still in its infancy.
Hope someone can help.
Warren James
Oct 18, 2012, 7:28:58 AM10/18/12
to nonoli...@googlegroups.com
S is always the way with forums I don't think a whole 5 minutes passed before I realized what was happening - despite having spent a good 1-2 hours playing around with the cee beforehand!!
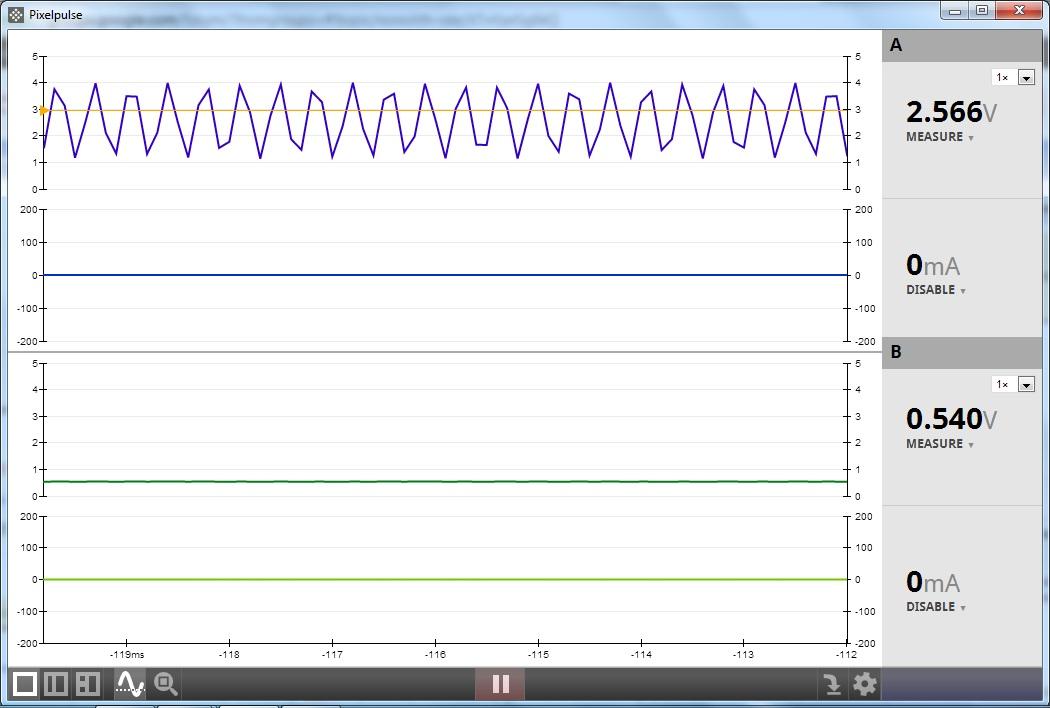
I had not realised before that double clicking the waveform zoomed in. After zooming in the waveform appears correctly - apart from some higher frequencies where the cee starts to struggle. I assume that the waveforms I uploaded with my previous post was caused by pixelpulse sampling the waveform below the nyquist criteria which causes the display to give an incorrect waveform which is only apparent when zoomed out because the displays sample rate stays the same across the display screen. i.e. zooming in increases the sample rate for the display.
I feel much happier now knowing this although I am still concerned with the waveforms at high frequencies see attached file. This appears to be something also to do with sampling as 20kHz waveform displays correctly.
Any ideas?
Also I still don't quite understand the difference between the main screen and the triggered screen.

Kevin Mehall
Oct 18, 2012, 4:09:53 PM10/18/12
to nonoli...@googlegroups.com
Hi Warren,
Thanks for your feedback. A more comprehensive way to show people how to use Pixelpulse and what's possible with CEE is definitely on the to do list, but here's a quick overview.
> I assume that the waveforms I uploaded with my previous post was caused by pixelpulse sampling the waveform below the nyquist criteria which causes the display to give an incorrect waveform which is only apparent when zoomed out because the displays sample rate stays the same across the display screen.
Yes, what you're seeing when triggering is disabled is the aliasing from the digital resampling used to display the signal. We've thought about improving that filter, but the visible aliasing can help indicate "There's a higher frequency signal here. Zoom in."
> I feel much happier now knowing this although I am still concerned with the waveforms at high frequencies see attached file. This appears to be something also to do with sampling as 20kHz waveform displays correctly.
At an 80kHz sample rate, that's 4.44 samples per period of the 18kHz wave. It does meet Nyquist so you can see the 18kHz frequency there, but that doesn't mean a "sine wave" plotted out of 4 points is going to be pretty. The non-integer 0.44 part means it samples at different positions on successive periods of the wave, which is why the peaks look irregular. You could draw an 18kHz wave through those points, but the view is an approximation by connecting the points with straight lines.
> Also I still don't quite understand the difference between the main screen and the triggered screen.
You'll see the utility of the non-triggering view if you try a slower or non-periodic signal. Check out the tutorial at http://wiki.nonolithlabs.com/cee/cEE101/Glow/ for a brief introduction to situations where the normal view is extremely useful.
Use the dropdown below the numeric voltage/current display to switch between controlling voltage and measuring current, or controlling current and measuring voltage. The Current stream also has a "Disable" option that is similar to setting it to 0mA, but turns off the output stage completely, increasing the input impedance when measuring an external voltage.
When paused, you can double-click to zoom in, or drag to pan to look at the signal more closely.
Just like on your oscilloscope, the triggering view displays repeated traces relative to a trigger event. To change the trigger, click in the left-side Y-axis of one of the graphs to set the trigger on that signal. If you're triggering on an input signal, the trigger event is when the value rises through the orange line. Drag the orange triangle to adjust this level. If triggering on a channel that is outputting a wave, the line is not shown, and the trigger is locked directly to the period of the waveform generated by the CEE on that channel.
In this triggering view, you can double-click to zoom in, and drag the view to pan while the CEE is active.
When a signal is configured as "source", you can click the waveform dropdown (looks like <-> for "constant", the default) to choose a waveform to generate, and then adjust the parameters numerically, or by dragging the dots on the graph, as shown in http://www.nonolithlabs.com/blog/2012/09-19-software-features.
> I was firstly a little disappointed that there was no negative swing on the voltage reading - a very basic feature to be left out even on an initial design of something essentially replicating an Oscilloscope in my opinion.
To clarify, CEE is a Source/Measure Unit (SMU), not an oscilloscope. Traditional devices that allow you to set and measure voltage and current have much slower sample rates and aren't designed for interactive use, let alone visual plotting and control. We added the oscilloscope-like triggering functionality to facilitate explorations in audio-frequency ranges, but weren't trying to match the functionality of your benchtop "beige-box" scope.
Since CEE can output voltage/current as well as measure them, expanding the voltage range beyond the 0-5V from USB would require a DC to DC converter, greatly increasing the complexity and cost of the hardware. As you discovered with your audio frequency generator, you can offset a small amplitude signal by 2.5V such that bipolar signals can be measured. When CEE is being used to power external devices, channel B can be set to 2.5V and used as a "virtual ground", allowing motors, peltier coolers, and other such devices to be operated fully bidirectionally.
Let us know if you have any other suggestions or questions, or find anything confusing. I hope this information helps you get the most out of your CEE.
Best Wishes,
--
Kevin Mehall
Nonolith Labs
Warren James
Oct 22, 2012, 9:30:58 AM10/22/12
to nonoli...@googlegroups.com
Thanks for clearing up those issues Kevin. Although I totally agree with you that Cee is not an Oscilloscope I think that most people would be looking at using a cee to give them the basic function that an Oscilloscope would do which was why I made that comment in the first place.
On Thursday, October 18, 2012 12:09:59 PM UTC+1, Warren James wrote:
Like I said - I think the Cee is an incredibly useful little tool and the more I am playing around with it the more it is growing on me.
I am currently playing around with methods of analyzing the data to give a frequency measure - the best solution I can see at the moment would most likely involve FFTW - an Open Source fast fourier transform software library. I need to brush up on my FFT to get my head around some of its use but if I manage to get some code working that performs a measure on data from the Cee then I will do my best to share it.
On Thursday, October 18, 2012 12:09:59 PM UTC+1, Warren James wrote:
Reply all
Reply to author
Forward
0 new messages