A Raspberry Pi, Node-Red, InfluxDB and Grafana
4,597 views
Skip to first unread message

Scott Penrose
Jan 28, 2015, 7:39:00 AM1/28/15
to node...@googlegroups.com
After a few good days logging my data to a file, then a SQLite db, plotting data manually, adding in freeboard (including read/writing config files to NR) I have now added InfluxDB and Grafana.
Turns out (thanks NR) to be easy.
- Install InfluxDB onto my Raspberry Pi (lots of steps, or just download package)
- Install Grafana into my already existing web directory
- Create a sensors DB and a grafana DB (grafana uses InfluxDB to store its own configuration)
- I just created a function to generate the correct JSON for InfluxDB and send it to a HTTP Request node
- Learn how to query and configure Grafana
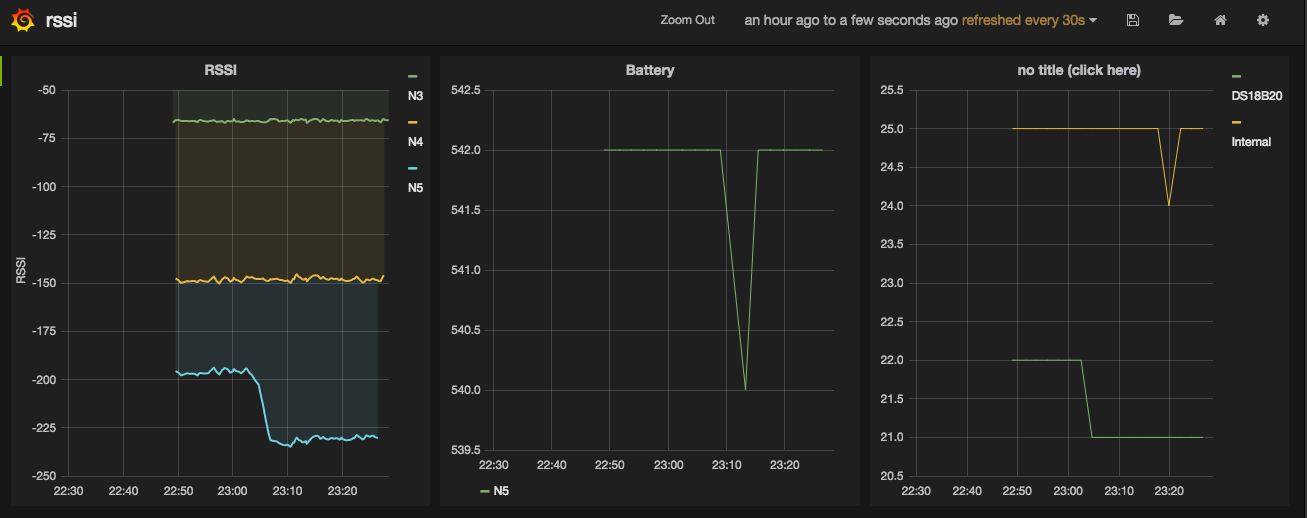
I plotted here my RSSI from 3 devices, internal battery voltage from my sample motes, and compared temperature from the internal CPU and an external 18B20 on one of my nodes.

Lawrence Griffiths
Jan 28, 2015, 9:51:02 AM1/28/15
to node...@googlegroups.com
Scott that is a very neat solution.
Any chance you could share your flow and learning on
>>Learn how to query and configure Grafana
I think many us do this in difrent ways.
Like you I use SQLite but use highchart to graph.
But switching to InfluxDB and/or Grafana looks very promising.
Lawrence
Scott Penrose
Jan 28, 2015, 3:14:01 PM1/28/15
to node...@googlegroups.com
I wonder if we could document the various ways together somewhere. Maybe I could load it into flows, with the description of what else todo and we could have them all there with "charting" or similar as a tag. Because finding some of this stuff takes an awful lot of digging. Then if we had an FAQ pointing to the flows for Dashboards and visualisation.
In the mean time here is my flow:
Short flow showing only the output to InfluxDB from a structure
[{"id":"13dd4139.ec22bf","type":"http request","name":"InfluxDB","method":"POST","ret":"txt","url":"http://localhost:8086/db/sensors/series?u=root&p=root","x":721,"y":179,"z":"d8506ee5.27af9","wires":[[]]},{"id":"99510d7.f66aef","type":"function","name":"Sensor to InfluxDB","func":"msg.payload = [\n {\n \"name\" : \"sensor\",\n \"columns\" : [\"nodeId\", \"sensorType\", \"sensorId\", \"val\", \"alt\", \"rssi\"],\n \"points\" : [\n [\n \tmsg.payload.nodeID,\n \tmsg.payload.Type,\n \tmsg.payload.ID,\n \tmsg.payload.Val,\n \tmsg.payload.Alt,\n \tmsg.payload.RSSI\n ]\n ]\n }\n];\n\nreturn msg;","outputs":1,"x":537,"y":178,"z":"d8506ee5.27af9","wires":[["13dd4139.ec22bf"]]}]
Full flow showing serial data from Motes, output to file, database, MQTT and InfluxDB.
[{"id":"500d21ad.aff2e","type":"mqtt-broker","broker":"localhost","port":"1883","clientid":""},{"id":"22073eed.ddf8c2","type":"sqlitedb","db":"/home/pi/data/motes.sqlite"},{"id":"2f701530.d08fea","type":"serial-port","serialport":"/dev/ttyAMA0","serialbaud":"115200","databits":"8","parity":"none","stopbits":"1","newline":"\\n","bin":"false","out":"char","addchar":true},{"id":"67204d52.98dfb4","type":"serial in","name":"Mote Gateway 1","serial":"2f701530.d08fea","x":85,"y":68,"z":"d8506ee5.27af9","wires":[["2631dc4e.d9ce24","1ccb47f1.e334b8","d923447b.26dcb8"]]},{"id":"2631dc4e.d9ce24","type":"debug","name":"Raw Serial","active":false,"console":"false","complete":"payload","x":304,"y":63,"z":"d8506ee5.27af9","wires":[]},{"id":"1ccb47f1.e334b8","type":"file","name":"File Raw Data","filename":"/home/pi/data/log/moterawdata.log","appendNewline":false,"overwriteFile":"false","x":315,"y":113,"z":"d8506ee5.27af9","wires":[]},{"id":"c7f4213.f380be","type":"sqlite","mydb":"22073eed.ddf8c2","name":"Motes SQLite","x":718,"y":67,"z":"d8506ee5.27af9","wires":[[]]},{"id":"d923447b.26dcb8","type":"function","name":"Parse MoteNode","func":"/* SENSOR Logger\nExample:\n SENSOR: nodeID=003, Type=0005, ID=01, Val=000001, Alt=-00077, RSSI=-075, Last=0000, UpTime=07278, RINFO: 2015-01-22T03:37:45 - FORWARD: STOP this is for me 001\n\n*/\nmsg.payload.replace(/[\\r\\n]/g,\"\");\nvar top = msg.payload.split(\": \");\nif (top[0] != \"SENSOR\") {\n\treturn [null,msg];\n}\n\t\nvar parts = top[1].split(\", \"); // TODO optional space\nmsg.payload = {};\nfor (var i = 0; i < parts.length; i++) {\n rec = parts[i].split(\"=\");\n msg.payload[rec[0]] = Number(rec[1]);\n}\n\n// Cleanup - numbers etc\n\n// TODO - check it is valid and return NULL with errors\n// test\nreturn [msg,null];\n","outputs":"2","x":310,"y":162,"z":"d8506ee5.27af9","wires":[["d0a8a57a.a98be8","2f69002a.fb3c58","99510d7.f66aef"],[]]},{"id":"b6a989cb.495678","type":"mqtt out","name":"Send SENSOR","topic":"","qos":"0","retain":"false","broker":"500d21ad.aff2e","x":725,"y":122,"z":"d8506ee5.27af9","wires":[]},{"id":"ce3d0b91.909f98","type":"comment","name":"Input Motes","info":"Test1","x":68,"y":27,"z":"d8506ee5.27af9","wires":[]},{"id":"d0a8a57a.a98be8","type":"template","name":"Sensor to MQTT","field":"topic","template":"sensor/{{payload.nodeID}}/{{payload.Type}}/{{payload.ID}}","x":535,"y":122,"z":"d8506ee5.27af9","wires":[["b6a989cb.495678"]]},{"id":"2f69002a.fb3c58","type":"template","name":"Sensor to SQL","field":"topic","template":"INSERT INTO sensor \n (nodeId, sensorType, sensorId, val, alt, rssi) \nVALUES \n (\n '{{payload.nodeID}}',\n '{{payload.Type}}',\n '{{payload.ID}}',\n '{{payload.Val}}',\n '{{payload.Alt}}',\n '{{payload.RSSI}}'\n )\n","x":523,"y":67,"z":"d8506ee5.27af9","wires":[["c7f4213.f380be"]]},{"id":"13dd4139.ec22bf","type":"http request","name":"InfluxDB","method":"POST","ret":"txt","url":"http://motegate:8086/db/sensors/series?u=root&p=root","x":721,"y":179,"z":"d8506ee5.27af9","wires":[[]]},{"id":"99510d7.f66aef","type":"function","name":"Sensor to InfluxDB","func":"msg.payload = [\n {\n \"name\" : \"sensor\",\n \"columns\" : [\"nodeId\", \"sensorType\", \"sensorId\", \"val\", \"alt\", \"rssi\"],\n \"points\" : [\n [\n \tmsg.payload.nodeID,\n \tmsg.payload.Type,\n \tmsg.payload.ID,\n \tmsg.payload.Val,\n \tmsg.payload.Alt,\n \tmsg.payload.RSSI\n ]\n ]\n }\n];\n\nreturn msg;","outputs":1,"x":537,"y":178,"z":"d8506ee5.27af9","wires":[["13dd4139.ec22bf"]]}]

Nicholas O'Leary
Jan 28, 2015, 3:29:08 PM1/28/15
to node...@googlegroups.com
Scott, there is always http://flows.nodered.org/ for sharing flows along with documentation. Admittedly the site is need of a revamp and tidy up now it has lots of content... but the essentials are there.
Nick
--
http://nodered.org
---
You received this message because you are subscribed to the Google Groups "Node-RED" group.
To unsubscribe from this group and stop receiving emails from it, send an email to node-red+u...@googlegroups.com.
For more options, visit https://groups.google.com/d/optout.

Julian Knight
Jan 29, 2015, 2:28:32 AM1/29/15
to node...@googlegroups.com
Well that looks interesting, I wonder if I could get InfluxDB installed on my Synology NAS? It is Intel architecture but has a limited toolchain. MongoDB was trivial because they don't really need to install, just run the pre-compiled binary and give it a data folder and it just works. I don't suppose InfluxDB was that easy?
Do you have a pointer to the RPi install instructions?
Do you have a pointer to the RPi install instructions?
On Wednesday, 28 January 2015 12:39:00 UTC, Scott Penrose wrote:
Scott Penrose
Jan 29, 2015, 5:46:28 PM1/29/15
to node...@googlegroups.com
On Thursday, January 29, 2015 at 6:28:32 PM UTC+11, Julian Knight wrote:
Well that looks interesting, I wonder if I could get InfluxDB installed on my Synology NAS? It is Intel architecture but has a limited toolchain. MongoDB was trivial because they don't really need to install, just run the pre-compiled binary and give it a data folder and it just works. I don't suppose InfluxDB was that easy?
Do you have a pointer to the RPi install instructions?
Yes three steps
- InfluxDB - http://www.pihomeserver.fr/en/2014/11/29/raspberry-pi-home-server-installer-influxdb/ - you can use these instructions, or even better install the binary package
- Freeboard install - I used this Gist to setup the change of root to /admin and providing a www/ directory - https://gist.github.com/dceejay/fb47301b759222e05f84
- Get copy of Grafana into your www directory.
Enjoy.
After a few days of data I do note that it gets pretty slow on my little Raspberry Pi. If I just look at last hour it is ok, try doing a query over 2 days, and it takes minutes to update a few graphs. But it is early days. And this solution is about occasional looking. If I wanted higher speed access etc I would move to a bigger machine, even if it is just for the InfluxDB etc.
Scott
Julian Knight
Jan 30, 2015, 3:37:22 AM1/30/15
to node...@googlegroups.com
Thanks for that Scott, I'll make a note in case I go down the same route.
I see though that you've already started to brush the limits of what a Pi can do. I'm not surprised, it really is tiny! That's why I have 2 Node-Red installations:
Of course, you could invest in one of the very many Pi wannabe's. Many of these are a little more powerful without being horribly expensive. Or indeed a Pi B+ which has a little more grunt.
I see though that you've already started to brush the limits of what a Pi can do. I'm not surprised, it really is tiny! That's why I have 2 Node-Red installations:
- on the Pi to capture all of the technical IO to/from the RFXCOM (LightwaveRF, HomeEasy and Oregon Scientific) and the Ciesco radios (remote Arduino sensors). I use NR here to listen to incoming transmissions and rebroadcast to MQTT, also to listen to MQTT for messages to send out to switches and the like.
- on the Synology to take the MQTT messages and rebroadcast (often in different forms) to web sockets for the home monitoring hub web site, to process the technical input, make sense of it, store it if needed using MongoDB, do the clever bits and so on. The Synology is a 412+ which is an Intel Atom with 1GB of RAM so, although it is also doing lots of other things (e.g. running the NAS), it still has enough capacity for NR to strut its stuff.
Of course, you could invest in one of the very many Pi wannabe's. Many of these are a little more powerful without being horribly expensive. Or indeed a Pi B+ which has a little more grunt.

Mark Setrem
Jan 30, 2015, 4:37:19 AM1/30/15
to node...@googlegroups.com
Julian, Not sure how 2 more USB ports and additional GPIO pins the RPi B+ has over the B would help here.

svante karlsson
Jan 30, 2015, 6:56:02 AM1/30/15
to node...@googlegroups.com
>After a few days of data I do note that it gets pretty slow on my little Raspberry Pi. If I just look at last hour it is ok, try doing a query over 2 days, and it takes minutes to update a few graphs. But it is early days. And this solution is about >occasional looking. If I wanted higher speed access etc I would move to a bigger machine, even if it is just for the InfluxDB etc.
I've been using raspberrys for displaying graphite/grafana dashboards at work for some time (sticked on the back of tv monitors) . The rendering of one of these usually takes some 30 seconds (and then I use a graphite server on zeon's with ssd) Obviously something is very heavy on both server and client side when using grafana/graphite. Maybe we should get the data away from the raspberrys and into something else either cloud or at home.
2015-01-30 10:37 GMT+01:00 Mark Setrem <mse...@gmail.com>:
Julian, Not sure how 2 more USB ports and additional GPIO pins the RPi B+ has over the B would help here.
Julian Knight
Jan 30, 2015, 11:58:09 AM1/30/15
to node...@googlegroups.com
Oops, my wrong. I thought they had updated the CPU & RAM but I think I got it confused with one of the Pi clones that have appeared.

Dave C-J
Jan 30, 2015, 2:08:37 PM1/30/15
to node...@googlegroups.com
Some of these are quite attractive... However one word of caution. The gpio is often mapped slightly differently so some of the "normal" drivers may not work without modification of the source. For example I had to put up a specific gpio node for the hummingboard. That has less features than the normal one - but the processor is very fast...

Marko S
Mar 4, 2016, 11:40:31 AM3/4/16
to Node-RED
So with the long time to render the graphs this option isn't so good for a Rpi2/3? (although these grafana graphs look sooo good :) )
Dne petek, 30. januar 2015 20.08.37 UTC+1 je oseba Dave C-J napisala:
Dne petek, 30. januar 2015 20.08.37 UTC+1 je oseba Dave C-J napisala:
Julian Knight
Mar 4, 2016, 5:20:43 PM3/4/16
to Node-RED
I'd forgotten about this conversation!
As it happens, I installed InfluxDB and Grafana just a few days ago. I was having repeated problems with MongoDB crashing as it reached its storage limits which are a bit silly on a 32bit platform like the Pi.
It will be interesting to see if InfluxDB has similar issues but so far I've been reasonably impressed though the install is not as easy as it should be. But after some discussions with some of the devs, I have some small hope they will listen to "reason" and create pre-compiled armhf versions suitable for the Pi2. You can get them now if you are prepared to use the nightly version.
Grafana is similarly fairly impressive though not without some bugs in the UI. Still, it is pretty trivial to produce some very nice looking charts from the InfluxDB data.
I've not seen any particular performance issues as yet and both Influx and Grafana seem pretty good at limiting the data returned.
I tried to create a publicly viewable snapshot of my trial dashboard but it didn't bring all the data over so it's missing a lot but you might get the idea,
Ah, a second try has produced a better result:
Still a few bits missing (a couple of tables) but you get the idea.
I haven't yet tried it with system monitoring though that is obviously one of the key uses of Influx/Grafana. All I would say is think about how often you are taking readings. Mine are happening about every 40-50 seconds and include 3-4 data points x4 or 5 devices. So that is still a lot of data. Ideally, you would filter out data that was similar to the previous reading & keep the frequency a bit lower. Maybe once a minute for relatively quick changing data.

Mike Lewis
Mar 7, 2016, 1:46:05 PM3/7/16
to Node-RED
Hi Julian - Did you install InfluxDB and Grafana on your Synology or a Pi?
FYI I have a very similar setup to you. I use Docker containers on my Synology for OpenHab and Node-Red. My pi just runs a local EmonCMS and Mosquito to Synology Mosquito and MariaDB server.
Julian Knight
Mar 7, 2016, 5:12:40 PM3/7/16
to Node-RED
Hi Mike,
I installed them onto my Pi. Not as easy as I'd hoped and I've given some feedback particularly to the InfluxDB devs.
Try this blog post: http://padcom13.blogspot.co.uk/2015/12/influxdb-telegraf-and-grafana-on.html
That worked for me apart from Telegraf which I didn't really need anyway.
I've taken most things off my Synology as I found it struggled if I threw too much onto it. I really need that to be stable as it is the local store for all our files (photos, music, videos, etc). I also use it to back up cloud files and then to back up everything to CrashPlan in the cloud. So that we have multiple copies of everything offsite.
So everything IoT server related runs on the Pi. NR, Influx, Grafana and Mosquitto.
On Monday, 7 March 2016 18:46:05 UTC, Mike Lewis wrote:
Hi Julian - Did you install InfluxDB and Grafana on your Synology or a Pi?FYI I have a very similar setup to you. I use Docker containers on my Synology for OpenHab and Node-Red. My pi just runs a local EmonCMS and Mosquito to Synology Mosquito and MariaDB server.
...
Reply all
Reply to author
Forward
0 new messages