Re: Deconvolution of 1D spectra
280 views
Skip to first unread message

Jonathan Helmus
Dec 5, 2014, 11:30:02 AM12/5/14
to nmrglue...@googlegroups.com
On 12/03/2014 04:39 AM, Kresten
Bertelsen wrote:
--Hi,I'm stuggeling with fitting of 1D spectra using the fit_spectrum function.Below is the code which gives the error and an overview of my parameters.# Read in some dataimport nmrglue as ng
import numpy as npdic, data = ng.bruker.read_pdata('./Data Files/P31_1D/10/pdata/1')
SF=dic['procs']['SF']
SW_p=dic['procs']['SW_p']
SI=dic['procs']['SI']
OFFSET=dic['procs']['OFFSET']
AX=np.linspace(OFFSET,OFFSET-SW_p/SF,SI)# Peak pick and deconvolutepeaktab = ng.analysis.peakpick.pick(data,np.max(data)*0.02)
# Prepare the inputs for deconvolution
lsh= list(["g" for x in range(np.size(peaktab['X_AXIS']))])
params=[]
for idx,peak in enumerate(peaktab['X_AXIS']):
params.append((peak,500))
amps=list(data[[int(x) for x in peaktab['X_AXIS']]])
bounds=[(0,1000) for x in range(np.size(peaktab['X_AXIS']))]
ampbounds =[(0,amps) for x in range(np.size(peaktab['X_AXIS']))]
centers = list(peaktab['X_AXIS'])
rIDs = list(tuple(peaktab['cID']))
box_width = tuple([(2000) for x in range(np.size(peaktab['X_AXIS']))])
a1, a2, a3, a4, a5 = ng.analysis.linesh.fit_spectrum(data,lsh,params,amps,bounds,ampbounds,centers,rIDs,box_width,0)This code gives the following errorC:\Anaconda\lib\site-packages\nmrglue\analysis\linesh.py in fit_spectrum(spectrum, lineshapes, params, amps, bounds, ampbounds, centers, rIDs, box_width, error_flag, ve rb, **kw) 243 244 for i in range(len(shape)): --> 245 bmin[:, i][np.where(bmin[:, i] < 0)] = 0 246 for i, v in enumerate(shape): 247 bmax[:, i][np.where(bmax[:, i] > v)] = v IndexError: too many indices for array
Here is an overview of my variablesVariable Type Data/Info --------------------------------- AX ndarray 131072L: 131072 elems, type `float64`, 1048576 bytes (1 Mb) OFFSET float 24.89154 SF float 242.937117583 SI int 131072 SW_p float 12175.3246753 ampbounds list n=11 amps list n=11 bounds list n=11 box_width tuple n=11 centers list n=11 data ndarray 131072L: 131072 elems, type `int32`, 524288 bytes (512 kb) dic dict n=1 idx int 10 lsh list n=11 ng module <module 'nmrglue' from 'C<...>es\nmrglue\__init__.pyc'> np module <module 'numpy' from 'C:\<...>ages\numpy\__init__.pyc'> params list n=11 peak float64 69279.0 peaktab recarray [(58584.0, 1, 34.0, 22646<...>021814548, -816324222.0)] rIDs list n=11 x int 10
You received this message because you are subscribed to the Google Groups "nmrglue-discuss" group.
To unsubscribe from this group and stop receiving emails from it, send an email to nmrglue-discu...@googlegroups.com.
For more options, visit https://groups.google.com/d/optout.
Kresten,
The fit_spectrum function is very particular about the formatting of the parameters, some of the ones you are passing have the incorrect layout. The documentation of the function [1] goes into detail on the expected layout of the various parameters. For starters, the bounds parameter has a min and max value for only one lineshape parameter. Gaussians lineshape's have two parameters, peak location and linewidth, so you must provide bounds for both of these parameters. Also keep in mind that all the lineshape parameters are in units of points and not NMR units like Hz, ppm, etc.
I've been meaning to write up an example of using fitting a spectrum using nmrglue's pick and fit_spectrum functions. Give me a few days and I should be able to come up with something to add to the documentation. I think having an example script that does something similar would be more helpful then running through the issues with the various function parameters.
Cheers,
- Jonathan Helmus
[1] http://nmrglue.readthedocs.org/en/latest/reference/generated/nmrglue.analysis.linesh.fit_spectrum.html#nmrglue.analysis.linesh.fit_spectrum

Paul Driscoll
Aug 1, 2017, 12:45:08 PM8/1/17
to nmrglue-discuss
Hi Jonathan,
Did this example ever appear? I'm currently trying to work out how to define bounds and ampbounds (1D spectrum at the moment)... Example code would be very helpful.
Cheers,
Paul
Jonathan Helmus
Aug 2, 2017, 9:44:26 AM8/2/17
to nmrglue...@googlegroups.com
Paul,
There is an example, "Find and fit peaks in a spectrum" in the nmrglue wiki that provides an example of using the fit_spectrum function in nmrglue. https://github.com/jjhelmus/nmrglue/wiki/Find-and-fit-peaks-in-a-spectrum
Cheers,
- Jonathan Helmus
There is an example, "Find and fit peaks in a spectrum" in the nmrglue wiki that provides an example of using the fit_spectrum function in nmrglue. https://github.com/jjhelmus/nmrglue/wiki/Find-and-fit-peaks-in-a-spectrum
Cheers,
- Jonathan Helmus
Paul Driscoll
Aug 2, 2017, 9:49:07 AM8/2/17
to nmrglue-discuss
Great Thanks Jonathan!

Alexandra Grigore
Oct 14, 2017, 10:24:50 AM10/14/17
to nmrglue-discuss
Hi Jonathan,
I've been trying to run the fitting example in the wiki and I get the following error:
[....]
File "C:\Users\nemes\AppData\Local\Programs\Python\Python35-32\lib\site-packages\nmrglue\analysis\linesh.py", line 277, in fit_spectrum
campbounds, wmask, error_flag, **kw)
File "C:\Users\nemes\AppData\Local\Programs\Python\Python35-32\lib\site-packages\nmrglue\analysis\linesh.py", line 459, in fit_NDregion
if len(dim_bounds) != dim_nparam[j]:
TypeError: object of type 'zip' has no len()
Reading and plotting data works fine though.
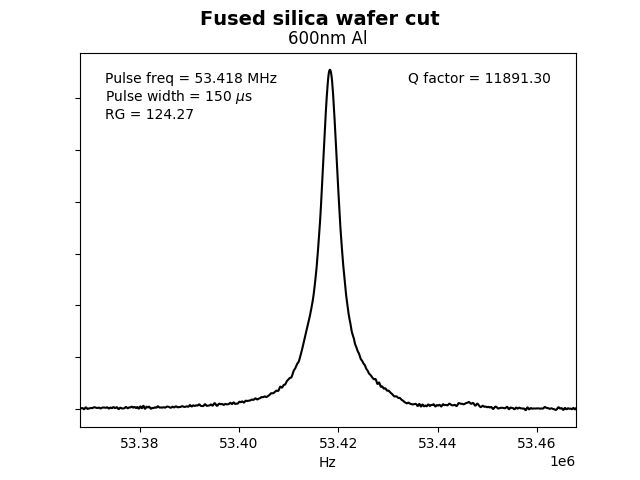
Also, what I actually need is not fitting but calculating the FWHM for many spectra like the one attached (which is proccessed from Bruker data with nmrglue), basically what peakw function does in TopSpin. I wanted to first fit a gaussian to the peak and then calculate it manuall. However, I see there is also this function: nmrglue.analysis.lineshapes1d.center_fwhm(signal) - but I am not sure how to use it. I'd really appreciate any hints. I tried using several general python scripts I found online for calculating the FWHM, but the results were pretty rubbish...
Thanks a lot!
Alex
On Wednesday, 2 August 2017 14:44:26 UTC+1, Jonathan Helmus wrote:
Jonathan Helmus
Oct 16, 2017, 11:15:39 AM10/16/17
to nmrglue...@googlegroups.com
The zip issue is a bug in nmrglue that has been fixed in the version
on GitHub [1]. You will need to install nmrglue from source if you
want to run the example in Python 3.
To accurately determine the FWHM for a peak you will need to fit the peak to some type of lineshape model. The nmrglue.analysis.lineshapes1d.center_fwhm function will give you a rough estimate of the peak center and FWHM by linear interpolation but this only an approximation, fitting the peak will give you a more accurate estimation.
Cheers,
- Jonathan Helmu
[1] https://github.com/jjhelmus/nmrglue/pull/73
Alexandra Grigore
Oct 22, 2017, 10:14:13 AM10/22/17
to nmrglue-discuss
That's great! Thanks a lot, I had no idea how to "install from source", but I just replaced the nmrglue folder in Python\Python35-32\Lib\site-packages with the one that I downloaded from git and it worked. I will try fitting some lineshapes and calculate the FWHM manually.
Alexandra Grigore
Oct 22, 2017, 1:20:21 PM10/22/17
to nmrglue-discuss
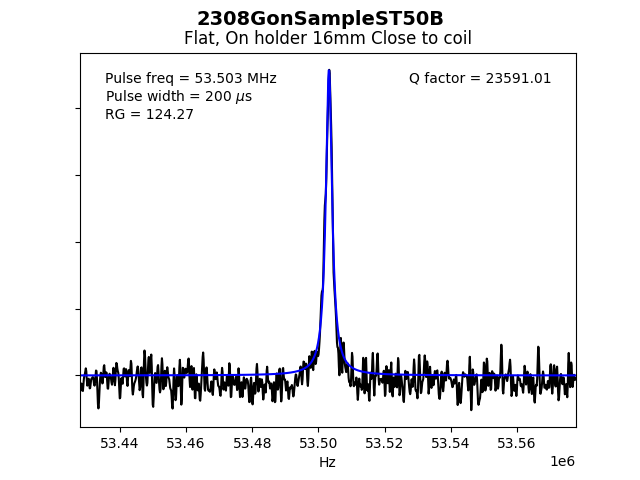
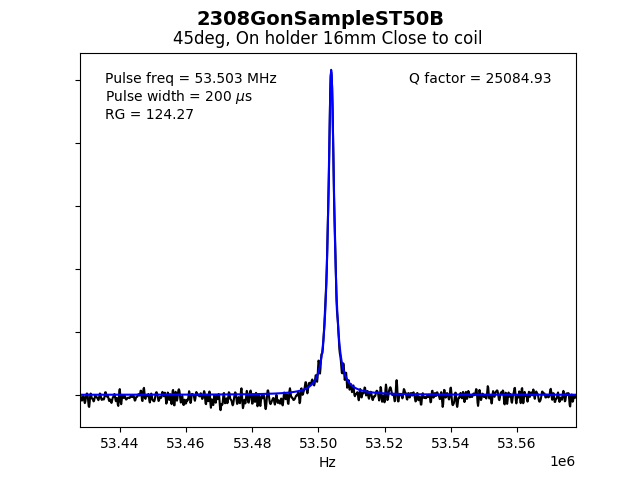
So I figured that the second fitting parameter for a lorenzian lineshape is the FWHM (in points). I managed to get almost the same values as TopSpin gives me with its peakw function. There is a difference when the spectrum is noisy (see attached) because the fitting shifts the baseline a bit higher and not in the middle of the noise. Any idea how I could adjust this?
Thanks a lot, nmrglue is such a life saviour - I will be citing this in the paper I am currently writing.
Reply all
Reply to author
Forward
0 new messages