Strange traceplots–parameters not getting sampled?

317 views
Skip to first unread message

Matthijs Hollanders

unread,
May 19, 2021, 10:59:08 PM5/19/21
to nimble-users
Hi everyone,

I realise I've posted a few threads on this forum already but I keep running into fresh issues. I'm running a multisite multistate CJS model which seems to be going well but some of my capture probabilities are showing strange traceplots, see attached. I can provide full code, but I'll just provide code for capture probabilities first to see if the problem can already be diagnosed. Surveys were conducted in the robust design so there's an extra j loop for secondary surveys:

for(m in 1:n.site){
    for(i in 1:n.ind[m]){
      for(t in 1:(n.primary-1)){
        for(j in 1:n.secondary){
          logit(pU[i,t,j,m]) <- p.x[1,m] + p.x[2,m]*sex[i,m] + p.t[t,m]
          logit(pI[i,t,j,m]) <- p.x[1,m] + p.x[2,m]*sex[i,m] + p.x[3,m] + p.t[t,m]
}
}
}
}

Capture probabilities are of uninfected (pU) and infected (pI) individuals. p.x[1:2,m] are site-specific intercepts and effects of sex, p.x[3,m] is the effect on capture probability of being infected, and p.t[t,m] is a random temporal effect. The priors for p.x are this:

for(m in 1:n.site){
    pU.0[m] <- ilogit(p.x[1,m]) # Intercept on the probability scale
    p.x[1,m] ~ dnorm(0, sd = 1.5)
    p.x[2,m] ~ dnorm(0, sd = 1.5)
    p.x[3,m] ~ dnorm(0, sd = 1.5)
}

Initial values for this parameter (the rest is omitted): 
function() list(p.x = array(runif(3*n.site,-1,1), c(3,n.site)))

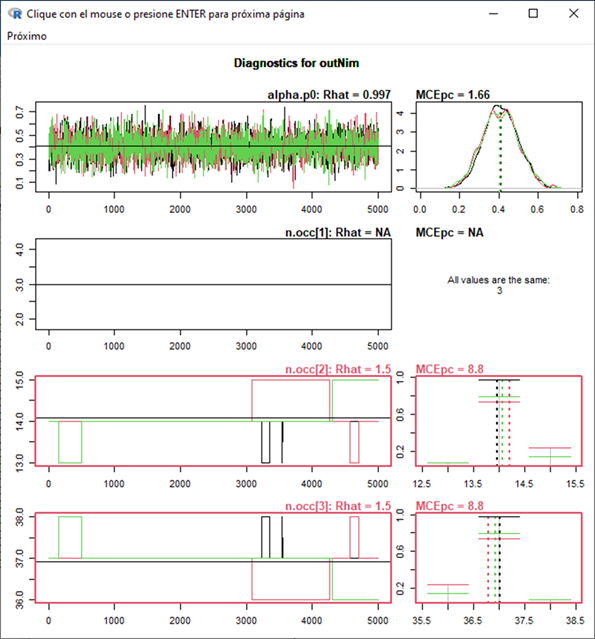
The model runs fine and I don't get any error messages, but the traceplots look off. For some reason, p.x[1:3,3] are estimated just fine, but p.x[1:3,1:2] don't seem to sample (the screenshot only shows p.x[1:3,2], but p.x[1:3,1] is the same). I am also deriving the site-specific mean capture probability per primary occasion, and those estimates also look reasonable....

Any ideas?

Kind regards,
Matt
 
Screen Shot 2021-05-20 at 11.06.40.png
Screen Shot 2021-05-20 at 11.06.29.png

Matthijs Hollanders

unread,
May 20, 2021, 8:06:42 PM5/20/21
to nimble-users
Just a quick update with some more info. If I specify the capture probabilities as random effects, the hyperparameters of each p.x is sampling fine, but still the site-specific values for sites 1 and 2 don't sample (but they do for 3).

Chris Paciorek

unread,
May 24, 2021, 11:10:38 AM5/24/21
to Matthijs Hollanders, nimble-users
hi Matthijs,

I'm not seeing anything obviously wrong in terms of the code you are showing. The problematic trace plots are interesting because for some of the parameters, they do change value very occasionally, so it's not that they never change. Is there anything fundamentally different about the data for sites 1 and 2 compared to site 3? Also, after you build the model, are all parameters initialized to semi-reasonable values?

I think to do anything further, we would need a reproducible example (off-list is fine if you have data you don't want to make public).

-chris

--
You received this message because you are subscribed to the Google Groups "nimble-users" group.
To unsubscribe from this group and stop receiving emails from it, send an email to nimble-users...@googlegroups.com.
To view this discussion on the web visit https://groups.google.com/d/msgid/nimble-users/42cf8b72-966f-409b-ac01-b24b44a0dd62n%40googlegroups.com.

Matthijs Hollanders

unread,
May 25, 2021, 5:01:03 AM5/25/21
to nimble-users
Hi Chris,

Thanks for your response. There's nothing really different between the three sites and site 3 actually has the fewest individuals. But the survival and state transition probabilities are getting sampled fine for all 3 sites. I think I'm setting reasonable initial values. I'm only initialising the hypermeans and standard deviations, with hypermeans getting intialised with rnorm(1,-1,1).

I was creating an reproducible R script but first reinstalled NIMBLE (for the second time already), and suddenly all p.x parameters were getting sampled. I took note of which initial values were created by my function and hopefully, if the issue recurs, I can use those initial values to make it run. Still, it's a bit worrisome... I've changed nothing in the code, but suddenly it works...

Kind regards,
Matt

Matthijs Hollanders

unread,
Jun 1, 2021, 9:31:59 PM6/1/21
to nimble-users
Hi Chris,

Could you tell me if this is common behaviour for the indicator variables in RJMCMC? I've now analysed two separate datasets, one the multistate CJS above and another a multinomial mixture model, where some of the indicator variables are stuck on 1. The effective sample size of the MCMC is 0, and there's jumping around between 0 and 1 at all. Not all indicator variables show this behaviour–for the CJS, the indicator variables for survival and transition probabilities sample fine, but not for the capture probabilities. I'm just wondering if this is expected with RJMCMC...

Regards,
Matt

David Pleydell

unread,
Jun 2, 2021, 1:57:26 AM6/2/21
to nimble-users
Hi Matt

Without a fully reproducable example it's not possibled to dig deep into the causes. There can be many reasons samplers may get stuck, so hard to diagnose from the limited information provided.

Best
David

Matthijs Hollanders

unread,
Jun 4, 2021, 3:54:21 AM6/4/21
to nimble-users
Chris solved this issue for–turns out there wasn't really one. The indicator variables for coefficients with posterior densities far away from 0 were always included in the model, thus appearing to not get sampled properly because moves away from 1 were always rejected. Thanks, Chris, for taking the time to respond to me so quickly, and many thanks again for the whole NIMBLE team for the package and users forum!

Jose.J...@uclm.es

unread,
Jan 28, 2022, 2:07:54 AM1/28/22
to nimble-users
Dear Nimble Team,

I have encountered a similar problem that Matt described in this thread; strange parameter-traceplots in a multistate model, as if the sampler was not working properly in those parameters. What exactly was the solution applied?

Thank you in advance,
José Jiménez

Rémi Patin

unread,
Jan 28, 2022, 12:35:57 PM1/28/22
to nimble...@googlegroups.com
Hi Nimble users,
I'm fairly new to custom distributions and I've recently tried to use an
hypergeometric distribution in one of my model, but I encountered an
error that I do not understand.

I cannot understand where does the error comes from, so if anyone has
any idea on how to debug this further I would be very grateful (I am
fairly confident that further bugs will appear but one step at a time).
When I run the attached script "run.R", the model is correctly loaded
and manage to run calculate().
However the first compileNimble() fails with the following error :

> Error in code[[i]] : subscript out of bounds

I attached a reproducible example with the custom distribution and
associated nimbleFunctions as well as the model and data.

To be totally transparent I based this work on this old conversation on
the list :
https://groups.google.com/g/nimble-users/c/g766aXzf5ps/m/B0NGGhAXAAAJ


I also have the secret hope that hypergeometric distribution are already
implemented in Nimble or someone has already worked with it, so feel
free to point out such information :-)

Cheers,
Rémi


function.R
run.R
data_inits.R
model.R

Daniel Turek

unread,
Jan 28, 2022, 4:23:38 PM1/28/22
to Rémi Patin, nimble-users
Rémi, thanks for the question.  It looks like seq() doesn't go through compilation, so try changing your nlchoose function to use the ":" operator, instead:

I also added the "returnType(double(0))" statement, which you should have as well, to specify the scalar return type of the function.

nlchoose <- nimbleFunction(
    run = function(n = double(0), k = double(0)){
        returnType(double(0))
        # if(any(is.na(c(n,k)))) return(NA)
        if(k != 0) {
            n <- round(n)
            k <- round(k)
            return(sum(log((n-k+1):n)) - sum(log(1:k)))
        } else {
            return(0)
        }
    }
)

I think this should work for you, but let us know if you still have problems.

Cheers,
Daniel


--
You received this message because you are subscribed to the Google Groups "nimble-users" group.
To unsubscribe from this group and stop receiving emails from it, send an email to nimble-users...@googlegroups.com.

Perry de Valpine

unread,
Jan 28, 2022, 8:52:22 PM1/28/22
to Daniel Turek, Rémi Patin, nimble-users
Thanks Daniel.

Also, the original code should have worked.  It reveals a little bug hidden in plain sight of handling seq through compilation.  I've just made a pull request on GitHub to fix it.  Thanks Rémi.

Perry

Rémi Patin

unread,
Jan 31, 2022, 4:24:56 AM1/31/22
to nimble-users
Thanks Daniel, Perry,
The code now works !
I attached the updated code if anyone is interested.
Cheers,
Rémi
hypergeometric_distribution.R

Chris Paciorek

unread,
Feb 1, 2022, 4:06:06 PM2/1/22
to Jose.J...@uclm.es, nimble-users
Hi Jose, I don't have detailed memory of this, but based on the email chain, it looks like there were indicators that were staying at 1, with their associated parameter staying in the model all the time because the posteriors for those parameters were concentrated well away from zero.

Can you say more what your strange traceplots look like?

-chris

Jose Jimenez Garcia-Herrera

unread,
Feb 1, 2022, 4:32:41 PM2/1/22
to Chris Paciorek, nimble-users

Hi Chris. Thanks for the response. In a multi-state model (with many NA data) the sampler seems not to update the occupancy values for the different states, with many of the z posteriors "frozen".


……

# DERIVED QUANTITIES

#####################

for (i in 1:M){

    occ1[i] <- equals(z[i], 1)

    occ2[i] <- equals(z[i], 2)

    occ3[i] <- equals(z[i], 3)

}

n.occ[1] <- sum(occ1[1:M]) # Sites in state 1

n.occ[2] <- sum(occ2[1:M]) # Sites in state 2

n.occ[3] <- sum(occ3[1:M]) # Sites in state 3

………


z Posteriors:


z[1]      3.00000 0.000000 0.000e+00      0.0000000

z[2]      3.00000 0.000000 0.000e+00      0.0000000

z[3]      3.00000 0.000000 0.000e+00      0.0000000

z[4]      3.00000 0.000000 0.000e+00      0.0000000

z[5]      3.00000 0.000000 0.000e+00      0.0000000

z[6]      3.00000 0.000000 0.000e+00      0.0000000

z[7]      3.00000 0.000000 0.000e+00      0.0000000

z[8]      3.00000 0.000000 0.000e+00      0.0000000

z[9]      3.00000 0.000000 0.000e+00      0.0000000

z[10]     2.00000 0.000000 0.000e+00      0.0000000

z[11]     2.90307 0.295877 2.416e-03      0.1091225

z[12]     2.58967 0.491911 4.016e-03      0.1263183

z[13]     2.00000 0.000000 0.000e+00      0.0000000

z[14]     2.00000 0.000000 0.000e+00      0.0000000

z[15]     3.00000 0.000000 0.000e+00      0.0000000

z[16]     2.02847 0.166307 1.358e-03      0.0383330

z[17]     3.00000 0.000000 0.000e+00      0.0000000

z[18]     2.82540 0.379637 3.100e-03      0.1412142


Chris Paciorek

unread,
Feb 5, 2022, 12:19:19 PM2/5/22
to Jose Jimenez Garcia-Herrera, nimble-users
Hmm, it is hard to diagnose without more detail. Would you be able to simplify this down to a minimal reproducible example and then send that information so I can reproduce what is going on?

-Chris

Jose Jimenez Garcia-Herrera

unread,
Feb 5, 2022, 2:08:51 PM2/5/22
to Chris Paciorek, nimble-users

Thank you Chris for your answer. Attached you can find the code and a subset of the data. I am aware of the amount of NA, but it works in WinBUGS and JAGS. That is why it was my question about the sampler.


Best regards,

Jose

MS.RData
MS_Nimble.r

Chris Paciorek

unread,
Feb 5, 2022, 4:24:41 PM2/5/22
to Jose Jimenez Garcia-Herrera, nimble-users
Hi Jose,

I think the issue is with the initial values, combined with how NIMBLE handles predictive node sampling by default. (Where the predictive nodes are those that have no dependencies and are simply sampled from their prior distributions conditional on the current parameter values at a given MCMC iteraation; in your case this is the missing y's.)

You start all the z's at 3. In the initial iterations. It looks like in the initial iterations (during burnin) the psi and r values get close to 1 and get stuck there. 
I think if you start the z's at a mix of values, things will look much better.

I think this stickiness is probably made much worse by the fact that the MCMC is also sampling the predictive nodes. And given how many of them there are, this probably causes a lot of posterior dependence. It's likely hard for the z's to mix because they are related to all of those predictive nodes, and the current values of those predictive nodes in any given MCMC iteration strongly constrains the z's. 

Given this, if you take a little time to rewrite the model to exclude the predictive nodes, this should greatly speed up the mixing (and the pure computational time of the MCMC). You would need to change the indexing of y[i,t] to be something like:

for(j in 1:nObserved)
 y[j] ~ dcat(p[z[ivec[j]],tvec[j],1:3])

where "ivec" and "tvec" map from 1:nObserved to the values of "i" and "t" for the observed y's. If you needed samples of the unknown y's you can easily do that with the MCMC output if you save samples of the z's.

As far as the difference with JAGS and BUGS, I believe that JAGS (and this may be true for BUGS too) is smarter than NIMBLE's default handling of predictive nodes -- in particular when updating parameters of the model, I suspect JAGS is having those updates not depend on the predictive nodes. 
Having our default MCMC configuration be smarter about predictive nodes is something we've talked about in some detail before on the development team but just haven't had time to improve yet. In part, this is because the user configurability of our MCMC means we have to make sure that if users modify a default MCMC configuration that ignores the predictive nodes when sampling the parameters, it doesn't create an incorrect MCMC.  I'll bring it up again for the team to think about.

-chris

Jose Jimenez Garcia-Herrera

unread,
Feb 5, 2022, 5:22:15 PM2/5/22
to Chris Paciorek, nimble-users

Thank you, Chris. Your explanations make perfect sense. I noticed that as missing data increases, correct sampling becomes more difficult. Using other inits values on z is not so easy, because I sent you a simplified code. Real code is extremely complex... But to clarify, your proposal is rewriting the MS code to avoid having to update the missing values and supply only the non-missing values as data. Isn’t it?


Best regards

Chris Paciorek

unread,
Feb 5, 2022, 5:38:18 PM2/5/22
to Jose Jimenez Garcia-Herrera, nimble-users
Yes, that's my suggestion. Hopefully even with the actual complex code, it would not be too difficult to make that modification.

-chris

David Christianson

unread,
Apr 8, 2023, 5:37:50 PM4/8/23
to nimble-users
Hello All, 
This thread has been helpful to me in getting started to fit a negative hypergeometric (thanks to Chris P on another thread). I have adapted the code posted here formulating the negative hypergeometric in the attached code.   The density function appears to recover data generating values.  However, the random number generation doesn't seem to generate posterior distributions for a missing data value.  I have attached code with a simple example that demonstrates the random number generation works as expected in R but can only produce '0' as an outcome in nimble.   I can't figure out why this is the case.

customnhyp.R

Chris Paciorek

unread,
Apr 11, 2023, 9:40:12 PM4/11/23
to David Christianson, nimble-users
Hi David,

I haven't fully worked through what is happening on the C++ side, but I think the issue is that `white`, `black` and `failures` need to be integer-valued. It's fine if they are of double type (nimble stores all numeric values internally in a model as doubles), but your prior doesn't constrain them to be integers. As a result nimble's samplers just treat them as continuous random variables and propose (and accept) non-integer values. Then I think that in the compiled `rnhyperg`, the behavior you see comes from trying to use a non-integer-valued value in `length = maxx-minx+1` or in `(minx+1):maxx` (since `maxx` is just `black`) or in passing non-integer values into `dnhyperg`.

I think you'll need a prior that treats the parameters as integer-valued and then nimble should assign a sampler that respects that.

-chris

David Christianson

unread,
Apr 12, 2023, 4:48:03 PM4/12/23
to nimble-users
That makes sense and is so obvious now.  Very helpful.   
Reply all
Reply to author
Forward
0 new messages