Network Analysis Ego Graph Layout
140 views
Skip to first unread message

Matthew Kline
May 12, 2022, 10:17:38 AM5/12/22
to networkx-discuss
Hello Everyone! I am working on a network analysis project and created a global network that can be filtered via an ego graph that shows the connections of a single node. I was wondering if anyone knows how to visually center a node with its connections surrounding it like a hub. I attached an image of what I am aiming to do. Thanks for any and all help!

Dan Schult
May 12, 2022, 10:23:01 AM5/12/22
to networkx...@googlegroups.com
`shell_layout` with the first shell just being the central node and the second shell being all neighbors should work.
`circular_layout` is also fine and you can always set the position of one node in the resulting dict manual to (0,0).
And if you want variation in the radius like your picture shows, you can construct your own position dict keyed
by node to a 2-tuple position value based on angle i*(2*pi/(n-1)) for node i and a random radius r within some range.
Then convert to x-y cords using x=r*cos(angle) and y=r*sin(angle). But that is essentially what the networkx functions
are doing -- without the randomness for the radius.
Matthew Kline
May 12, 2022, 10:46:46 AM5/12/22
to networkx-discuss
Thanks for the quick response! I think the shell layout would be easiest if that works. This is the code I currently have how would I set it up; this code is within a function so "(item)" is the node that I would like to center. I am very new to networkX so I really appreciate your help!
NetworkX website has the shell layout set as
shell_layout(G, nlist=None, rotate=None, scale=1, center=None, dim=2). curious about what I would need to set each of these options to. Thanks again!
G_sub= nx.ego_graph(G, (item) ,radius=1, center=True, undirected=True, distance='weight')
pos = nx.shell_layout(G_sub)
for n, p in pos.items():
G_sub.nodes[n]['pos'] = p
for n, p in pos.items():
G_sub.nodes[n]['pos'] = p
plt.figure(figsize=(10, 10))
nx.draw_networkx(G_sub, pos, alpha =.8, width= Weight/50)
nx.draw_networkx(G_sub, pos, alpha =.8, width= Weight/50)
Matthew Kline
May 12, 2022, 10:50:02 AM5/12/22
to networkx-discuss
I have a massive main network "G" that I am filtering by "(item)" so I do not know what to input for nlist most importantly
Dan Schult
May 12, 2022, 11:13:07 AM5/12/22
to networkx...@googlegroups.com
The `nlist` input parameter is a list of lists. That is a list of the collections of nodes you want at each layer of the shell.
So something like this should work (untested):
others = list(G_sub)
others.remove(item)
nlist=[(item,), others]Also, you don't need to set the 'pos' attribute on the nodes of the graph. It is sufficient to pas the dict `pos` into the `draw_networkx` command.
Matthew Kline
May 12, 2022, 12:31:12 PM5/12/22
to networkx-discuss
Thanks Dan that worked! What do you mean exactly with your 'pos' comment? My networkx graph works with a central node but now it doesn't work when I transform it into a plotly figure.
Matthew Kline
May 12, 2022, 12:53:14 PM5/12/22
to networkx-discuss
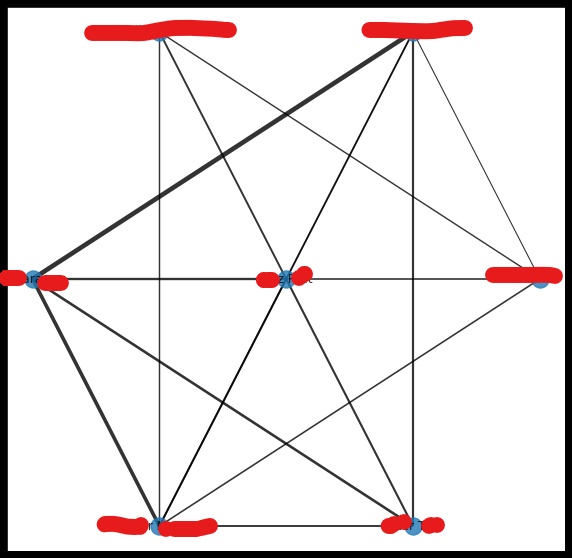
Actually, I got everything to work! One final question. The graph visually looks much better now that the main node is centered, but do you know if there is a way to offset this node at all? I only ask because there are connections that now run through that node and it is impossible to tell if these connections are passing through the central node or if they are connections made strictly by the central node. I have attached an image below to better display it.
Reply all
Reply to author
Forward
0 new messages