Problem with plotting a MultiDiGraph instance
36 views
Skip to first unread message

Saverio
Aug 15, 2022, 4:30:14 PM8/15/22
to networkx-discuss
Hi all,
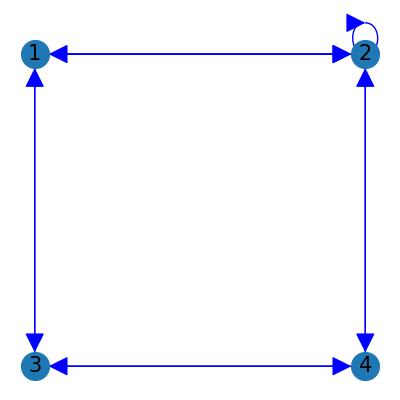
multidigraph= nx.MultiDiGraph()
multidigraph.add_nodes_from( [ '1','2','3','4' ] )
multidigraph.add_edges_from( [ ('1','2') , ('1','2') , ('2','1') , ('2','2') , ('1','3') ,
('3','1') , ('2','4') , ( '3' , '4' ) , ( '4' , '3' ) , ( '4' , '2' ) ] )
plt.figure( 1 , figsize = ( 4 , 4 ) )
node_positions = { '1' : [ 0 , 1 ] , '2' : [ 1 , 1 ] , '3' : [ 0 , 0 ] , '4' : [ 1 , 0 ] }
nx.draw( multidigraph , pos = node_positions , with_labels = True , font_size = 15 , node_size = 400, edge_color = 'blue', arrowsize = 30 )
plt.show()
I have executed the following code:
import networkx as nx
import matplotlib.pyplot as plt
import matplotlib.pyplot as plt
multidigraph= nx.MultiDiGraph()
multidigraph.add_nodes_from( [ '1','2','3','4' ] )
multidigraph.add_edges_from( [ ('1','2') , ('1','2') , ('2','1') , ('2','2') , ('1','3') ,
('3','1') , ('2','4') , ( '3' , '4' ) , ( '4' , '3' ) , ( '4' , '2' ) ] )
plt.figure( 1 , figsize = ( 4 , 4 ) )
node_positions = { '1' : [ 0 , 1 ] , '2' : [ 1 , 1 ] , '3' : [ 0 , 0 ] , '4' : [ 1 , 0 ] }
nx.draw( multidigraph , pos = node_positions , with_labels = True , font_size = 15 , node_size = 400, edge_color = 'blue', arrowsize = 30 )
plt.show()
In the plot are not present all the edges.
To be more precise in the plot one edge represents more egdes in the edge list.
Where I'm wrong?
Any suggestions to plot all the edges?
Thanks.
Saverio

Borjan Milinkovic
Oct 8, 2022, 6:01:59 PM10/8/22
to networkx-discuss
Hi Saverio,
I'd like to double up on this actually. This has been happening to me too.
Any hints on how to solve this issue would be useful.
Thanks in advance.
Best wishes,
Borjan
Reply all
Reply to author
Forward
0 new messages