Intragranular Misorientation Distribution for Selected Grains
110 views
Skip to first unread message

Mustafa Rifat
Oct 30, 2020, 11:50:43 PM10/30/20
to MTEX
Hello MTEX Community,
I want to find intragranular misorientation of selected grains from my ebsd plot. I am trying to do something like this demo page: https://mtex-toolbox.github.io/HomepageOld/files/doc/GrainMisorientationAnalysis.html#22
I got some help from this page also: https://mtex-toolbox.github.io/GrainOrientationParameters.html
Now what I am trying is like this:
[grains,ebsd.grainId] = calcGrains(ebsd);
%My grain Ids are 489 and 490
ori = ebsd(ebsd.grainId == 490).orientations;
mis2mean = inv(grains(490).meanOrientation) .* ori;
figure
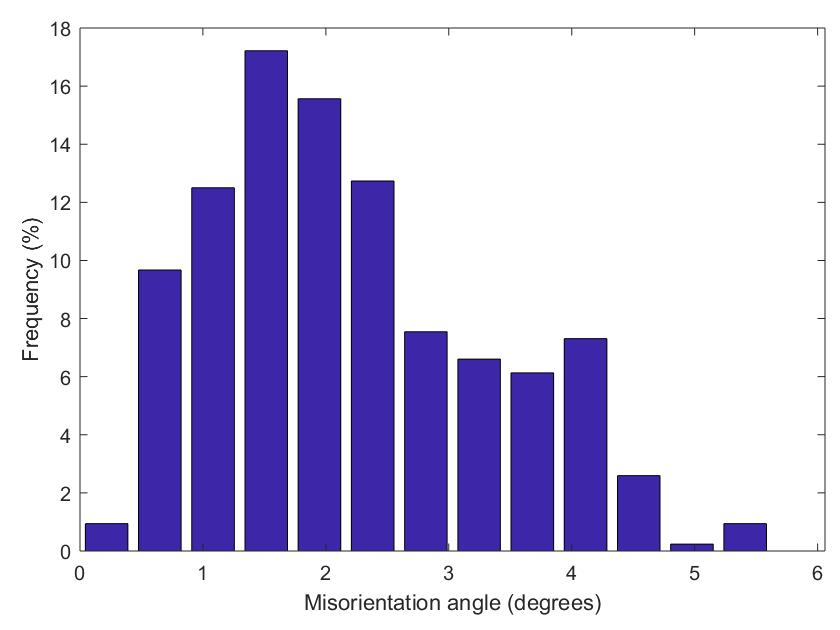
plotAngleDistribution(mis2mean)
This gives me a plot like this:
If I do the same for grain 489, I get another plot like this.
However, I want a single histogram containing data for both grains. I want to tell by looking at the histogram how the distribution looks like together i.e. is the distribution bimodal (the grains have very different intragranular misorientation distribution) or not.
Can anyone help me in this regard?
Thank you!

Ralf Hielscher
Oct 31, 2020, 12:27:41 AM10/31/20
to MTEX
Dear Mustafa,
could you please use the new forum at
as this forum is going to be shut down.
Thank you,
Ralf.
Reply all
Reply to author
Forward
0 new messages