Pole Figure Plot for VPSC Texture
561 views
Skip to first unread message

Omar Al-Abri
Aug 29, 2015, 7:54:33 AM8/29/15
to MTEX
Dear Ralf,
Greetings,
I'm trying to plot pole figure of a texture data that have been obtained from VPSC. The format of the data is as follows:

As you may know that the first three columns are the Euler angles. I want to plot a pole figure to show the texture distribution. When I try to import the pole figure data through the import wizard, MTEX is not recognizing the format and a new screen "PoleFigure Generic Interface" comes out to specify how the columns should be interpreted. But, I'm not able to till MTEX that these are the Euler angles. The only options available are: polar angle, azimuth angle, intensity, etc. So, how can I read such format in MTEX?

Rémy Bretin
Aug 31, 2015, 10:23:42 AM8/31/15
to MTEX
Hello,
I think you should take a look at this https://groups.google.com/forum/#!topic/mtexmail/qGaU4k0JeEc
The correct script for a format file of euler angles written this way :
293.3005 163.0425 45.7153
328.8153 113.8247 35.1145
..............................
100.2594 98.4387 344.7025
347.3599 28.3704 349.4134
is :
ori = loadOrientation_generic('eugler_File.txt','ColumnNames',{'Euler1','Euler2','Euler3'})
plotIPDF(ori,[xvector,yvector,zvector],'contourf')
Ralf Hielscher
Aug 31, 2015, 11:13:44 AM8/31/15
to MTEX
Hi Omar Al-Abri,
the answer by Rémy Bretin is correct. The point is that you do not have pole figure data but individual orientations which represent an ODF. If you want to use the import wizard you should select ODF at the top page.
I hope this helps,
Ralf.
Omar Al-Abri
Sep 1, 2015, 12:39:13 AM9/1/15
to MTEX
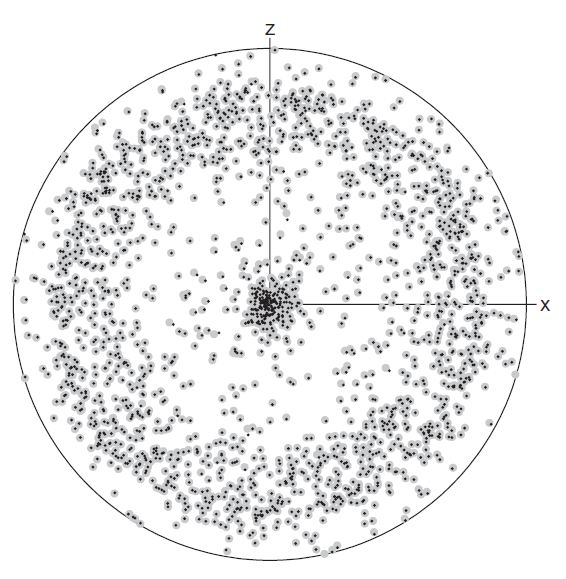
Thanks Ralf and Remy,
Can we get the pole figure plot as points instead of contour? like the following picture:

Italo Persechino
Sep 1, 2015, 7:41:53 AM9/1/15
to mtex...@googlegroups.com
I usually use
ebsd = loadEBSD_generic(fname,'ColumnNames',{'Euler1','Euler2','Euler3'},'HEADER',4);
which I think it's better than go through ODF.
That function is specific for importing data from VPSC
Omar Al-Abri
Sep 1, 2015, 10:30:44 AM9/1/15
to MTEX
Hi Italo
Thanks for your reply. I tried your suggestion; however, I'm facing a problem with the plotting. I'm trying to plot the angles as markers (as shown in below figure) but without success!
Ralf Hielscher
Sep 1, 2015, 2:10:23 PM9/1/15
to MTEX
Italo Persechino
Sep 1, 2015, 3:31:17 PM9/1/15
to MTEX
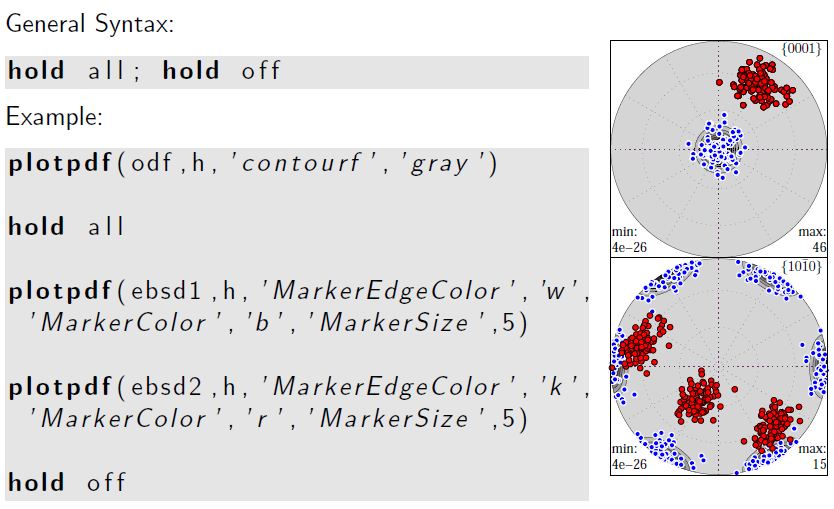
that is easy:
try this out for Pole figures, it should work.... I hope :)
this is the code I use to plot Inverse pole figures:
%Specify Miller Indice
m1 = Miller(0,0,1,CS);m2 = Miller(1,0,1,CS);m3 = Miller(1,1,1,CS);
%Specify vector
v1 = vector3d(1,0,0);v2 = vector3d(0,1,0);v3 = vector3d(0,0,1);
%% plot IPF from EBSD discrete

plotIPDF(ebsd.orientations,v1,'MarkerSize',2,'PaperPositionMode','auto')annotate([Miller(m1),Miller(m2),Miller(m3)],'all','labeled')
try this out for Pole figures, it should work.... I hope :)

dikai...@sheffield.ac.uk
May 29, 2017, 10:46:31 AM5/29/17
to MTEX
Hi Omar,
I am now doing the same job like what you did before. I need to consider the Weight of each orientation when I plot the PF.
Can you share me the code?
If anyone in this group did the similar work before, please help me out
The VPSC texture output file has 4 columns:
Euler1 Euler2 Euler3 Weights
Thanks very much
Dikai
ruediger Kilian
May 29, 2017, 11:08:03 AM5/29/17
to mtex...@googlegroups.com
Hi,
did you try something like :
ori = loadOrientation_generic(yourinput,'CS',CS,'SS',SS, 'ColumnNames', {'Euler1' 'Euler2' 'Euler3' 'Weights'},'Columns',[1,2,3,4],'Bunge’)
Cheers,
Rüdiger
On 29 May 2017, at 4:46 pm, <dikai...@sheffield.ac.uk> <dikai...@sheffield.ac.uk> wrote:
> Hi Omar,
>
> I am now doing the same job like what you did before. I need to consider the Weight of each orientation when I plot the PF.
> Can you share me the code?
>
> If anyone in this group did the similar work before, please help me out
>
> The VPSC texture output file has 4 columns:
> Euler1 Euler2 Euler3 Weights
>
> Thanks very much
>
> Dikai
>
> On Saturday, 29 August 2015 12:54:33 UTC+1, Omar Al-Abri wrote:
> Dear Ralf,
>
> Greetings,
>
> I'm trying to plot pole figure of a texture data that have been obtained from VPSC. The format of the data is as follows:
>
>
>
>
> If you want to reduce the number of emails you get through this forum login to https://groups.google.com/forum/?fromgroups=#!forum/mtexmail, click "My membership" and select "Don't send me email updates". You can still get emails on selected topics by staring them.
> ---
> You received this message because you are subscribed to the Google Groups "MTEX" group.
> To unsubscribe from this group and stop receiving emails from it, send an email to mtexmail+u...@googlegroups.com.
> Visit this group at https://groups.google.com/group/mtexmail.
> For more options, visit https://groups.google.com/d/optout.
did you try something like :
ori = loadOrientation_generic(yourinput,'CS',CS,'SS',SS, 'ColumnNames', {'Euler1' 'Euler2' 'Euler3' 'Weights'},'Columns',[1,2,3,4],'Bunge’)
Cheers,
Rüdiger
On 29 May 2017, at 4:46 pm, <dikai...@sheffield.ac.uk> <dikai...@sheffield.ac.uk> wrote:
> Hi Omar,
>
> I am now doing the same job like what you did before. I need to consider the Weight of each orientation when I plot the PF.
> Can you share me the code?
>
> If anyone in this group did the similar work before, please help me out
>
> The VPSC texture output file has 4 columns:
> Euler1 Euler2 Euler3 Weights
>
> Thanks very much
>
> Dikai
>
> On Saturday, 29 August 2015 12:54:33 UTC+1, Omar Al-Abri wrote:
> Dear Ralf,
>
> Greetings,
>
> I'm trying to plot pole figure of a texture data that have been obtained from VPSC. The format of the data is as follows:
>
>
>
>
> As you may know that the first three columns are the Euler angles. I want to plot a pole figure to show the texture distribution. When I try to import the pole figure data through the import wizard, MTEX is not recognizing the format and a new screen "PoleFigure Generic Interface" comes out to specify how the columns should be interpreted. But, I'm not able to till MTEX that these are the Euler angles. The only options available are: polar angle, azimuth angle, intensity, etc. So, how can I read such format in MTEX?
>
>
>
>
> --
>
>
>
>
> If you want to reduce the number of emails you get through this forum login to https://groups.google.com/forum/?fromgroups=#!forum/mtexmail, click "My membership" and select "Don't send me email updates". You can still get emails on selected topics by staring them.
> ---
> You received this message because you are subscribed to the Google Groups "MTEX" group.
> To unsubscribe from this group and stop receiving emails from it, send an email to mtexmail+u...@googlegroups.com.
> Visit this group at https://groups.google.com/group/mtexmail.
> For more options, visit https://groups.google.com/d/optout.
Reply all
Reply to author
Forward
0 new messages