Overlay of Band Contrast Map and Inverse Pole Figure Map - Transparency
709 views
Skip to first unread message

James Bizarre
Dec 15, 2015, 6:11:27 AM12/15/15
to MTEX
Dear mtex-users,
I am trying to plot an overlay of a band contrast map and an inverse pole figure map. In general this works, just as in this example:
http://mtex-toolbox.github.io/files/doc/EBSDSpatialPlots.html (Combining different plots)
I am trying to plot an overlay of a band contrast map and an inverse pole figure map. In general this works, just as in this example:
http://mtex-toolbox.github.io/files/doc/EBSDSpatialPlots.html (Combining different plots)
I am however encountering that, as soon as I overlay the nverse pole figure map on the bandcontrast map, the contrast of the band contrast map decreases significantly.
This is probably due to the white areas in the inverse pole figure map, which are plotted for the second phase, absent in the orientation plot.
How can I remove those white areas before I do the overlay, in order to maintain the contrast of the band contrast map?
If I change the "FaceAlpha" value, also the colored part would loose intensity, which is not what I am going for.
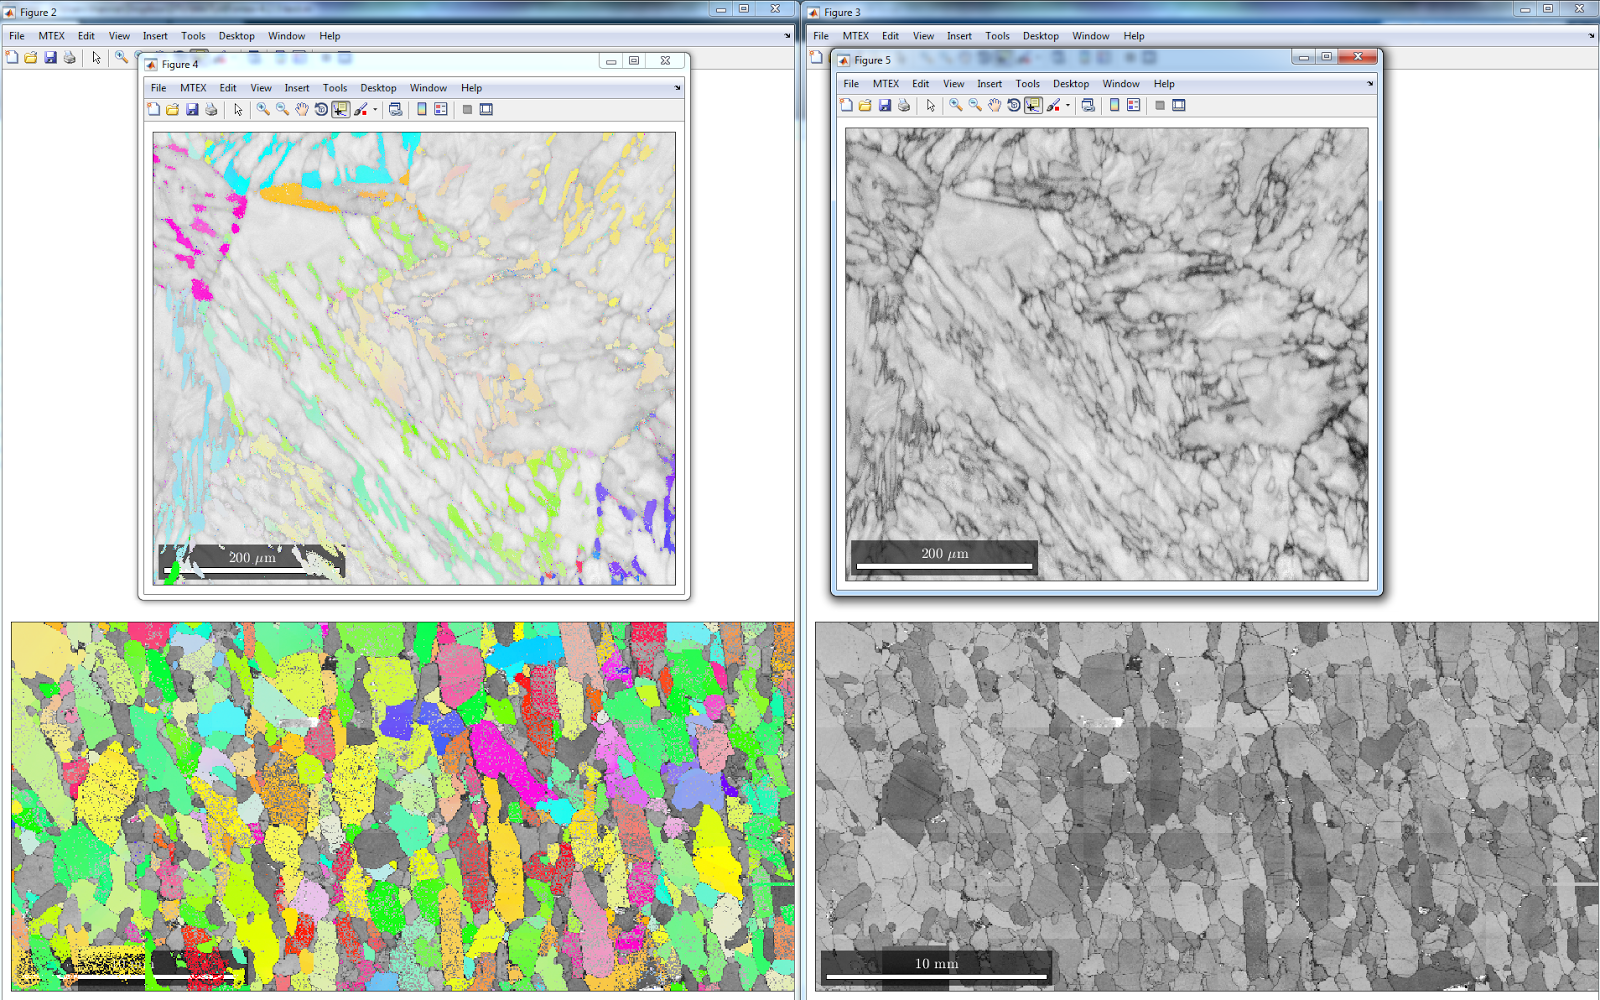
I attached the two maps and the resulting overlay to this thread. I would be most thankful for any kind of input.
If I change the "FaceAlpha" value, also the colored part would loose intensity, which is not what I am going for.
I attached the two maps and the resulting overlay to this thread. I would be most thankful for any kind of input.
James Bizarre
Dec 22, 2015, 5:19:32 PM12/22/15
to MTEX
Anyone any idea?
It would be grately appreciated.
It would be grately appreciated.

Ralf Hielscher
Jan 9, 2016, 6:14:22 AM1/9/16
to MTEX, drumm...@gmail.com
you may do
to plot only the orientations of a specific phase.
plot(ebsd('phase'),ebsd('phase').orientations)to plot only the orientations of a specific phase.
Ralf.
James Bizarre
Jan 26, 2016, 12:17:28 PM1/26/16
to MTEX, drumm...@gmail.com
Dear Ralf,
thank you for your answer. This is what I am doing right now and it leaves me with the same problem. All data not belonging to the phase is plotted in white instead of left out or transparent and takes away the contrast of my previously plotted band-contrast map.
Is there a possibility to indicate that the not chosen phases shoult be plotted transparent instead of white? Or is there a possibility to only plot the band contrast map for the 2nd phase, so that I could first plot the orientation data for the first phase and afterwards the bandcontrast map for the second phase only?
Ralf Hielscher
Jan 31, 2016, 8:59:55 AM1/31/16
to MTEX, drumm...@gmail.com
Hi James,
when I do
mtexdata forsterite
plot(ebsd,ebsd.bc)
hold on
plot(ebsd('Fo'),ebsd('Fo').orientations,'FaceAlpha',0.25)
hold off
The regions that are not overlayed look exactly as if I only plot the band contrast. Actually, MTEX does NOT plot regions in a white color that should not be plotted. May I aski which MTEX version you are using?
Ralf.
James Bizarre
Feb 1, 2016, 3:47:28 AM2/1/16
to mtex...@googlegroups.com, drumm...@gmail.com
Dear Ralf,
thank you for the reply.
I tried your example code and I can confirm what you say. I assumed that m-tex does plot white color because of what I experienced with my data. The same code applied on my data does still not work, please see the attached image.
Could the data format be a potential error source, meaning the system the data has been aquired with? My data is acquired with a Bruker system and I read in the data in 'brukertxt'-format.
The m-text version is 4.2.1. Thank you for your support.
Reply all
Reply to author
Forward
0 new messages