Visualization pictures with the output of the current MCS.
29 views
Skip to first unread message

Эрвин Визард
Jan 7, 2022, 5:24:55 PM1/7/22
to Morpheus users
Dear colleagues, good evening!
Tell me, please, is it possible to display the value of the current Monte Carlo time step (MCS) on the visualization pictures of the simulated system (gnu-plots which can be composed in the movies after)?
Tell me, please, is it possible to display the value of the current Monte Carlo time step (MCS) on the visualization pictures of the simulated system (gnu-plots which can be composed in the movies after)?

Lutz Brusch
Jan 8, 2022, 7:09:06 AM1/8/22
to Morpheus users
Dear Эрвин,
the current TIME point is printed by default under each (single) Gnuplotter image, e.g. the "300" at the bottom right in this screenshot.
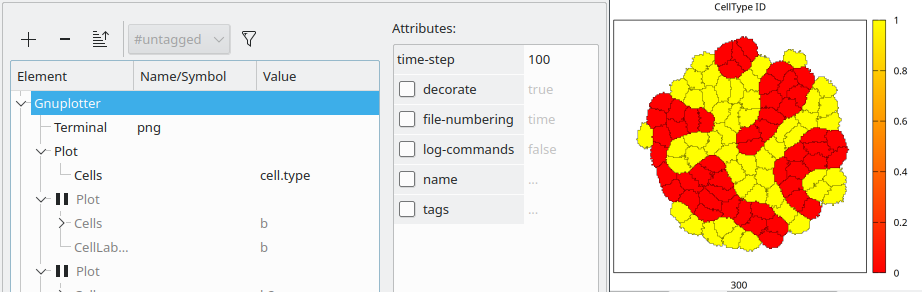
Printing the (optional) title and color-bar and time stamp around the cell pattern plot can be suppressed by ticking the tick-box Gnuplotter/Attribute/decorate and selecting "false". Otherwise, when the Attribute is ticked and set to "true" or when it is unticked (hence the default "true" to be used) then the time stamp will be printed. Note, this model time is only equivalent to the number of MC steps if MCSDuration=1 (as in the built-in Example/CellSorting-2D). If you had MCSDuration=0.1 then already 3000 MC steps were done when the plot shows the time stamp 300 (this universal model time is the meaningful quantity when coupling CPM with ODEs and PDEs, each potentially running at different solver step sizes).
This all works well when a single plot is enabled in Gnuplotter and the corresponding movies nicely run through the time stamps then. When two or more plots are enabled in the same Gnuplotter, then the time stamp should be inserted once at the bottom right of each multi-panel plot. However, the arrangement of the plots and subdivision of the canvas sometimes shift the time stamp onto or beyond the lower canvas edge (fixing this is on the todo list). Sometimes you are lucky with the multi-panel plot nicely placing the time stamp, if not and you need to plot multiple properties simultaneously - then you may use multiple Gnuplotter elements, each with a single plot (potentially only one of them having "decorate=true", others "false") and later run the single movies simultaneously on your slides.
Best,
Lutz
Эрвин Визард
Jan 8, 2022, 4:50:28 PM1/8/22
to Morpheus users
Thank you very much!!
I checked your decision: It works well!
Small question from my side: can we turn off title and color legend on the right side but turn on time? :)
I checked your decision: It works well!
Small question from my side: can we turn off title and color legend on the right side but turn on time? :)
суббота, 8 января 2022 г. в 15:09:06 UTC+3, Lutz Brusch:
Lutz Brusch
Jan 10, 2022, 4:52:30 AM1/10/22
to Morpheus users
Dear Эрвин,
these rendering options can
only be partially adjusted through the GUI. Time stamp and color legend
go on or off together when you toggle the attribute "decorate" but the
title (by default set as the color-coded Symbol) can be cleared
(workaround for "turned off") by ticking the Gnuplotter/Plot/title
tickbox under Attributes and inserting a space into the string field.
For
more flexibility, you can save the plain cell pattern with
"decorate=off" as usual which has the time at the end of each file name
and then use an external package to read the time from the file name and
insert it into the image with many options (and then rendering the
movie), for instance by modifying this shell command for imagemagick and
looping over the image file names:
https://stackoverflow.com/questions/23236898/add-text-on-image-at-specific-point-using-imagemagick
Best,
Lutz
Reply all
Reply to author
Forward
0 new messages