Modeling cell to cell communication

Deepa
Hi All,
I am trying to build a simple model to understand cell to cell communication. I was looking for libraries that focus on modelling , I came across Morpheus in the literature and also got to know more about Morpheus during the FitMultiCell presentation at the COMBINE conference.
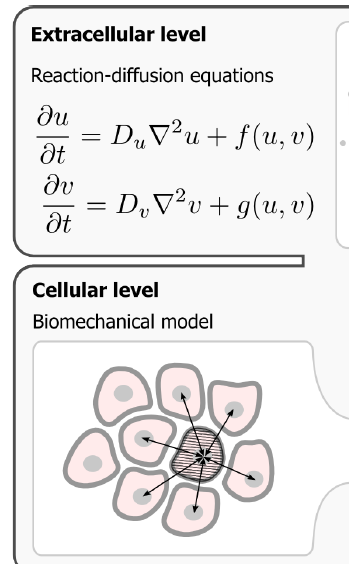
To start with, I want to model the diffusion of a drug molecule from one cell to an adjacent cell. While reading through Walter's thesis I found the illustration shown below. In my model , I don't want to model the extracellular medium , instead I want to model the intercellular communication i.e. reaction-diffusion between cells.
(ref)
If there are examples of such a system that is already set up and simulated in Morpheus, could someone please direct me to the examples available on GitHub repository?
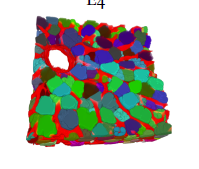
I would also like to know where I can locate the Morpheus model file of the figure displayed in table 3.1 (3D cell shapes imported from TIFF images (image courtesy of Zerial lab, MPI-CBG).) of Walter's thesis. (Unfortunately, I couldn't find it here Supplementary Online Material under http://walter.deback.net/thesis)
Thanks a lot for your time and kind attenton,
Deepa

Lutz Brusch
Deepa
the figure displayed in table 3.1 (3D cell shapes imported from TIFF images (image courtesy of Zerial lab, MPI-CBG).) of Walter's thesis. (Unfortunately, I couldn't find it here Supplementary Online Material under http://walter.deback.net/thesis)
--
You received this message because you are subscribed to a topic in the Google Groups "Morpheus users" group.
To unsubscribe from this topic, visit https://groups.google.com/d/topic/morpheus-users/QAl-I1RV0Cc/unsubscribe.
To unsubscribe from this group and all its topics, send an email to morpheus-user...@googlegroups.com.
To view this discussion on the web visit https://groups.google.com/d/msgid/morpheus-users/1423d1f4-5820-41cf-b6b0-1ef55ad5dab9n%40googlegroups.com.
Deepa
ContactLogger records the all aspects of cell-cell contacts, such as the cell ids of both cells and the length of the contact interface.
time cell.id cell.type neighbor.id neighbor.type length
1640 1 0 2 0 15.2
1640 2 0 1 0 15.2
1660 1 0 2 0 17.6
1660 2 0 1 0 17.6
...
Thanks a ton, Lutz. The tutorial videos are helping me a lot in understanding how a system is set up in Morpheus.
On Fri, Oct 15, 2021 at 5:51 PM Lutz Brusch <lutz....@tu-dresden.de> wrote:
Hi Deepa,
in addition, please have a look at these tutorial videos:
Best,Lutz
You received this message because you are subscribed to the Google Groups "Morpheus users" group.
To unsubscribe from this group and stop receiving emails from it, send an email to morpheus-user...@googlegroups.com.
To view this discussion on the web visit https://groups.google.com/d/msgid/morpheus-users/CAGchuN7ExLwQEgLCoDtZhtgmfqxzmfZVB197c59hFi3hgo2GWQ%40mail.gmail.com.
--
Dr. Lutz Brusch
Research Group Leader, PI of Morpheus.lab
Center for Information Services and High Performance Computing (ZIH)
Technische Universität Dresden
D-01062 Dresden
Germany
email: lutz....@tu-dresden.de
www: https://tu-dresden.de/zih and https://digs-bb.de/brusch
Tel: +49 (0) 351 463 38553
Lutz Brusch
Deepa
To view this discussion on the web visit https://groups.google.com/d/msgid/morpheus-users/7a004d3e-9dc7-483f-8c7e-8364000889dbn%40googlegroups.com.
Deepa
<Center>72.076388889,81.409722222,0</Center>
<Nodes>68, 75, 0;69, 75, 0;70, 75, 0;71, 75, 0;67, 76, 0;68, 76, 0;69, 76, 0;70, 76, 0;71, 76, 0;72, 76, 0;73, 76, 0;74, 76, 0;75, 76, 0;76, 76, 0;67, 77, 0;68, 77, 0;69, 77, 0;70, 77, 0;71, 77, 0;72, 77, 0;73, 77, 0;74, 77, 0;75, 77, 0;76, 77, 0;77, 77, 0;78, 77, 0;79, 77, 0;66, 78, 0;67, 78, 0;68, 78, 0;69, 78, 0;70, 78, 0;71, 78, 0;72, 78, 0;73, 78, 0;74, 78, 0;75, 78, 0;76, 78, 0;77, 78, 0;78, 78, 0;66, 79, 0;67, 79, 0;68, 79, 0;69, 79, 0;70, 79, 0;71, 79, 0;72, 79, 0;73, 79, 0;74, 79, 0;75, 79, 0;76, 79, 0;77, 79, 0;78, 79, 0;67, 80, 0;68, 80, 0;69, 80, 0;70, 80, 0;71, 80, 0;72, 80, 0;73, 80, 0;74, 80, 0;75, 80, 0;76, 80, 0;77, 80, 0;78, 80, 0;67, 81, 0;68, 81, 0;69, 81, 0;70, 81, 0;71, 81, 0;72, 81, 0;73, 81, 0;74, 81, 0;75, 81, 0;76, 81, 0;77, 81, 0;78, 81, 0;67, 82, 0;68, 82, 0;69, 82, 0;70, 82, 0;71, 82, 0;72, 82, 0;73, 82, 0;74, 82, 0;75, 82, 0;76, 82, 0;77, 82, 0;67, 83, 0;68, 83, 0;69, 83, 0;70, 83, 0;71, 83, 0;72, 83, 0;73, 83, 0;74, 83, 0;75, 83, 0;76, 83, 0;77, 83, 0;68, 84, 0;69, 84, 0;70, 84, 0;71, 84, 0;72, 84, 0;73, 84, 0;74, 84, 0;75, 84, 0;76, 84, 0;68, 85, 0;69, 85, 0;70, 85, 0;71, 85, 0;72, 85, 0;73, 85, 0;74, 85, 0;75, 85, 0;76, 85, 0;68, 86, 0;69, 86, 0;70, 86, 0;71, 86, 0;72, 86, 0;73, 86, 0;74, 86, 0;75, 86, 0;76, 86, 0;69, 87, 0;70, 87, 0;71, 87, 0;72, 87, 0;73, 87, 0;74, 87, 0;75, 87, 0;76, 87, 0;69, 88, 0;70, 88, 0;71, 88, 0;72, 88, 0;73, 88, 0;74, 88, 0;75, 88, 0;70, 89, 0;71, 89, 0;72, 89, 0</Nodes>
Deepa
Lutz Brusch
Deepa
Hi Deepa,
1. Yes, you as the modeler decide for the spatial unit (often 1 micrometer is appropriate, so let us here choose 1 micrometer) and the time unit (often 1 minute is appropriate) of your model. If Lattice/Nodelength is kept at 1, then a lattice node will be 1 micrometer wide. You then have to scale all parameters that you know from measurements or literature sources to these same units. Then all results can be interpreted with these same units. Hence you pick a lattice size and target volume that correspond to your chosen units and then cell.volume in a 3D model will have the unit µm^3 (cubic micrometers). In 2D, cell.volume will give the area of the cell in µm^2 (square micrometers). The surface in 3D or circumference in 2D of the cell will get the unit µm^2 (square micrometers) or µm, respectively. The shape of the cell is internally smoothed such that you do not get artifacts from lattice anisotropy. The degree of this smoothing is controlled by the parameter CPM/Shape/Neighborhood/Order or Distance (see the CellSorting example). This is also described in the GUI/Documentation when you click on CPM/Shape/Neighborhood. The volume and surface are then calculated from the smoothed cell shape instead of counting all edges of the voxels that you see in the visualization.
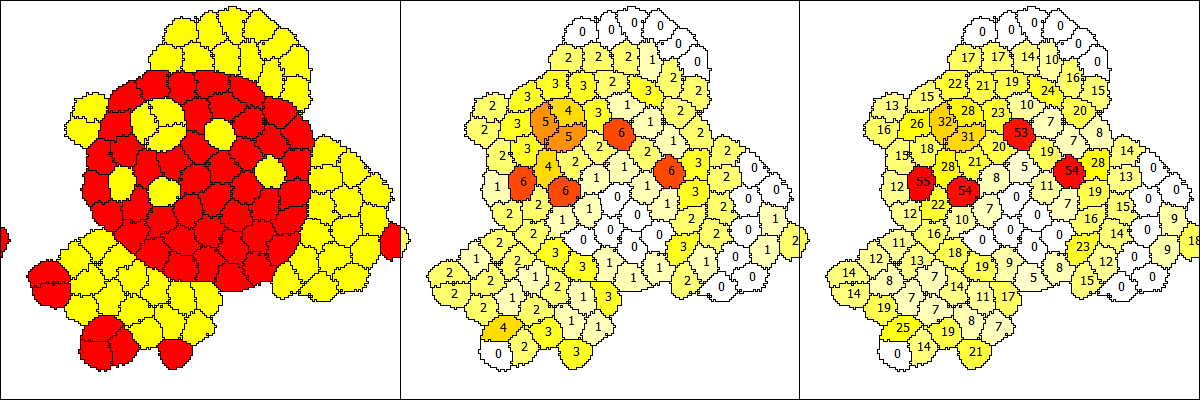
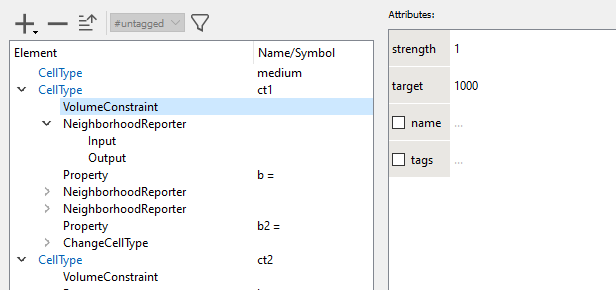
2. The visualization of the GUI/Example/CellSorting is determined by Analysis/Gnuplotter/Plots and that has three Plot sections. The first gives the CellType ct1 vs. ct2, the second counts the number of neighbors of a different type and the third plot sums the contact lengths with all neighbors of a different CellType. These Properties b and b2 are calculated for each cell as defined by NeighborhoodReporters in each CellType.
Please also use the GUI/Documentation and click on each line in all model sections. The documentation should explain a lot of these (but not yet all) aspects. There is also a navigation panel above the documentation panel and you may walk through parts of it. We'll also further extend that documentation.
Best,Lutz
On 27.10.21 18:26, Deepa wrote:
Hi Lutz,Thanks a lot for the detailed explanation. This clarifies a lot of my doubts.
Kindly excuse me for asking a few more questions
1. Can we translate the cell size (given by cell.volume = number of lattice nodes) to physical dimensions?e.g. if I want to compute the area of a cell (composed of several lattice nodes) how can we compute it? From what I understand the cell.surface symbolgives the cell's perimeter in lattice nodes; would it be right to retrieve the coordinates of the lattice nodes that form the boundary of each cell to compute the area in physical units?Likewise, I would like to know how we can compute the volume of a cell in physical units.
2. Could you please explain a bit about what the id's (0, 2, 17) on the cells (yellow, white, red regions in the center and right plots) denote?
Thanks a lot for your time and kind attention,Deepa
To view this discussion on the web visit https://groups.google.com/d/msgid/morpheus-users/5cceb2cf-dd56-4dfc-9960-0aa1dbc3f1a0n%40googlegroups.com.
Lutz Brusch
Deepa
Hence you pick a lattice size and target volume that correspond to your chosen units and then cell.volume in a 3D model will have the unit µm^3 (cubic micrometers).
To view this discussion on the web visit https://groups.google.com/d/msgid/morpheus-users/0206c084-1acc-4c38-947f-360ab5311762n%40googlegroups.com.
Lutz Brusch
Deepa
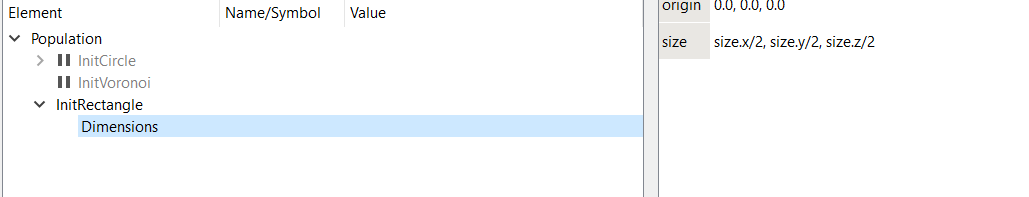
CellPopulation/Population/size gives the minimum size of the cell population, i.e. the minimum number of cells that you expect to be generated upon initialization. One or multiple generators may add such cells below the Population element and each specifies its own contributed "number-of-cells".
NOTE: Contrary to other places, size is given in nodes.
To view this discussion on the web visit https://groups.google.com/d/msgid/morpheus-users/7c958066-d8f0-4831-a9af-5f5dccfe67dbn%40googlegroups.com.
Deepa
...............
<PropertyData symbol-ref="orientation" value="0.2"/>
<PropertyData symbol-ref="sumC" value="26.875437853"/>
<Center>51.285714286,79.185714286,0</Center>
<Nodes>54, 73, 0;52, 74, 0;53, 74, 0;54, 74, 0;50, 75, 0;51, 75, 0;52, 75, 0;53, 75, 0;54, 75, 0;48, 76, 0;49, 76, 0;50, 76, 0;51, 76, 0;52, 76, 0;53, 76, 0;54, 76, 0;48, 77, 0;49, 77, 0;50, 77, 0;51, 77, 0;52, 77, 0;53, 77, 0;54, 77, 0;48, 78, 0;49, 78, 0;50, 78, 0;51, 78, 0;52, 78, 0;53, 78, 0;54, 78, 0;48, 79, 0;49, 79, 0;50, 79, 0;51, 79, 0;52, 79, 0;53, 79, 0;54, 79, 0;48, 80, 0;49, 80, 0;50, 80, 0;51, 80, 0;52, 80, 0;53, 80, 0;54, 80, 0;48, 81, 0;49, 81, 0;50, 81, 0;51, 81, 0;52, 81, 0;53, 81, 0;54, 81, 0;48, 82, 0;49, 82, 0;50, 82, 0;51, 82, 0;52, 82, 0;53, 82, 0;54, 82, 0;49, 83, 0;50, 83, 0;51, 83, 0;52, 83, 0;53, 83, 0;54, 83, 0;49, 84, 0;50, 84, 0;51, 84, 0;52, 84, 0;53, 84, 0;54, 84, 0</Nodes>
</Cell>
Lutz Brusch
Deepa
Error: Can't open file: ''!
Reading the output of simulation not possible!
To view this discussion on the web visit https://groups.google.com/d/msgid/morpheus-users/f34acefc-401c-4f57-8799-50b4453c302bn%40googlegroups.com.
Deepa
Error: Can't open file: ''!
Reading the output of simulation not possible!
Lutz Brusch
- Note, even with high Time/StopTime, your VolumeConstraint will not affect cell shapes as long as you don't activate the CPM section of your model (double-click on CPM in the GUI) and select a suitable temperature (=1 by default). Keeping CPM off, Morpheus will use the initial cell configuration and run all other processes on top of that static geometry.
- I could not reproduce your error message "...Can't open file...". The new model runs again and again.
Best,
Lutz
Deepa
This defines the size of the rectangular subdomain within which the requested number of cells get seeded but each cell with just ONE lattice node
Deepa
Lutz Brusch
Deepa
--
You received this message because you are subscribed to a topic in the Google Groups "Morpheus users" group.
To unsubscribe from this topic, visit https://groups.google.com/d/topic/morpheus-users/QAl-I1RV0Cc/unsubscribe.
To unsubscribe from this group and all its topics, send an email to morpheus-user...@googlegroups.com.
To view this discussion on the web visit https://groups.google.com/d/msgid/morpheus-users/65a36468-277f-408d-93f0-5e63e497d780n%40googlegroups.com.