How to view the data restrict to one domain [Question on ParaView]
53 views
Skip to first unread message

Wesley
Jul 18, 2018, 10:12:23 AM7/18/18
to moose-users
Hi all,
I believe people use ParaView here but I am not sure if it is appropriate to post the questions regarding ParaView, If not I will simply delete it.
Below is my question,any help would be much appreciated.
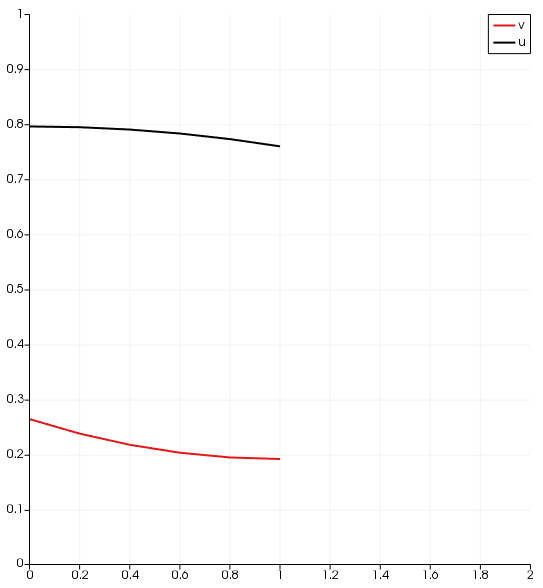
I am using PlotOverLine in ParaView to visualize my data from variable u and v. In my 1-D simulation u and v have some value through whole domain, but actually for my problem u is only valid in domain 1 (0<x<1) and v is only valid in domain 2 (1<x<2).
Can we get rid of (or say, hidden) the data I don’t like here? e.g., u only shows its curve from 0 to 1 and v only shows its curve from 1 to 2.

If I try the following:
Generate two PlotOverLine;
In the 1st I choose to show u from coordinate (0 0 0) to (1 0 0);
In the 2nd I choose to show v from coordinate (1 0 0) to (2 0 0).
It will actually give me v plot from 0 to 1, not 1 to 2.

Alexander Lindsay
Jul 18, 2018, 12:12:28 PM7/18/18
to moose...@googlegroups.com
For your second plot, change the X Array Name from arc_length to Points_X
--
You received this message because you are subscribed to the Google Groups "moose-users" group.
To unsubscribe from this group and stop receiving emails from it, send an email to moose-users+unsubscribe@googlegroups.com.
Visit this group at https://groups.google.com/group/moose-users.
To view this discussion on the web visit https://groups.google.com/d/msgid/moose-users/b343b3ee-43b3-400c-b931-2ade27ea873a%40googlegroups.com.
For more options, visit https://groups.google.com/d/optout.
Wesley
Jul 18, 2018, 12:24:58 PM7/18/18
to moose-users
It works, thank you Alex!
On Wednesday, July 18, 2018 at 12:12:28 PM UTC-4, Alexander Lindsay wrote:
For your second plot, change the X Array Name from arc_length to Points_X
On Wed, Jul 18, 2018 at 8:12 AM, Wesley <zuzup...@gmail.com> wrote:
Hi all,
I believe people use ParaView here but I am not sure if it is appropriate to post the questions regarding ParaView, If not I will simply delete it.
Below is my question,any help would be much appreciated.
I am using PlotOverLine in ParaView to visualize my data from variable u and v. In my 1-D simulation u and v have some value through whole domain, but actually for my problem u is only valid in domain 1 (0<x<1) and v is only valid in domain 2 (1<x<2).
Can we get rid of (or say, hidden) the data I don’t like here? e.g., u only shows its curve from 0 to 1 and v only shows its curve from 1 to 2.
If I try the following:
Generate two PlotOverLine;
In the 1st I choose to show u from coordinate (0 0 0) to (1 0 0);
In the 2nd I choose to show v from coordinate (1 0 0) to (2 0 0).It will actually give me v plot from 0 to 1, not 1 to 2.
--
You received this message because you are subscribed to the Google Groups "moose-users" group.
To unsubscribe from this group and stop receiving emails from it, send an email to moose-users...@googlegroups.com.

Derek Gaston
Jul 18, 2018, 12:36:06 PM7/18/18
to moose...@googlegroups.com
A couple more tips:
1. Don't forget the MOOSE has it's own line sampling capability: http://mooseframework.org/moose/source/vectorpostprocessors/LineValueSampler.html . You can output CSV files that you can then easily plot with any plotting tool.
2. Just FYI: When we output a subdomain restricted variable using Exodus... the part of the domain where the variable is NOT defined is just set to "0"... so visualization tools (like Paraview) will always draw things thinking that the solution varies from 0 to the actual solution over one layer of elements. It's just an unfortunate visualization effect (you can see it here on your first plot).
Derek
To view this discussion on the web visit https://groups.google.com/d/msgid/moose-users/d33c7579-76c3-435d-83ba-983df9a696fc%40googlegroups.com.
Wesley
Jul 18, 2018, 3:36:52 PM7/18/18
to moose-users
Thanks for your information, Derek.
Reply all
Reply to author
Forward
0 new messages