memory leak PowerOfTwoBufferPool class

tommy li

Kevin Adistambha
Hi,
To investigate this issue, do you mind opening a ticket in the Java driver Jira project with all the relevant information? It would be helpful if you can also provide the code that can induce this behaviour.
Best regards,
Kevin
Kevin Adistambha
Hi,
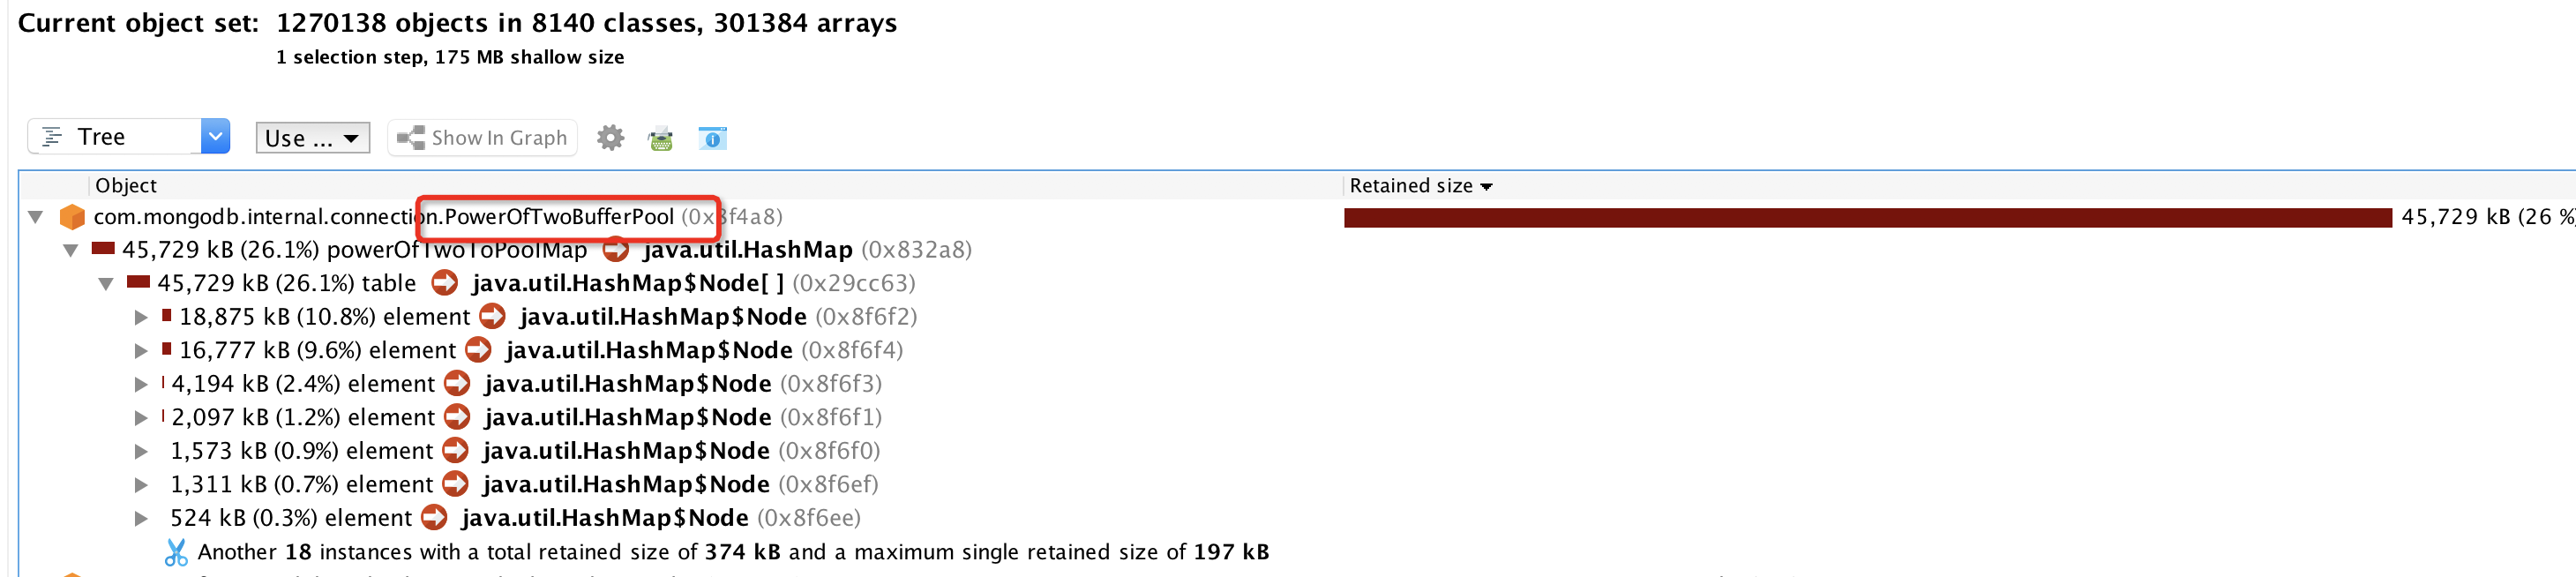
I did some digging about PowerOfTwoBufferPool and have found that this behaviour is expected since PowerOfTwoBufferPool is a cache. Hence it may look like a leak.
In short, the PowerOfTwoBufferPool holds a number of pools of ByteBuffer instances, each pool containing a set of equal-sized buffers. The smallest size is 1K, and the largest is 16MB, incrementing in power of two sizes from 1K to 16MB. The size of each pool of equal-sized buffers is not limited, and is determined by application usage. Once a buffer is cached in a pool, it remains pooled (or in-use) until the MongoClient is closed. As a result, it’s totally expected that during introspection of JVM state, the contents of the pools would show as a leak suspect, just as any cache would.
The PowerOfTwoBufferPool exists in order to reduce GC load. It’s fairly well known that modern garbage collectors in the JVM treat large allocations differently from smaller ones, so if an application were to not do any pooling of large objects (like these buffers) it will have the effect of increasing GC load, because the garbage collector has to do more work collecting these large objects than it does smaller ones. The cost of this is that the driver holds on to memory that could be used by other parts of the application. In particular, it holds on to enough memory to handle the largest peak load seen so far by the application.
Best regards,
Kevin