Potential Energy Curves (PEC) for poly-atomic molecules
49 views
Skip to first unread message

Sagar Vadhel
Dec 3, 2022, 6:00:34 AM12/3/22
to molpro-user
Hello everyone
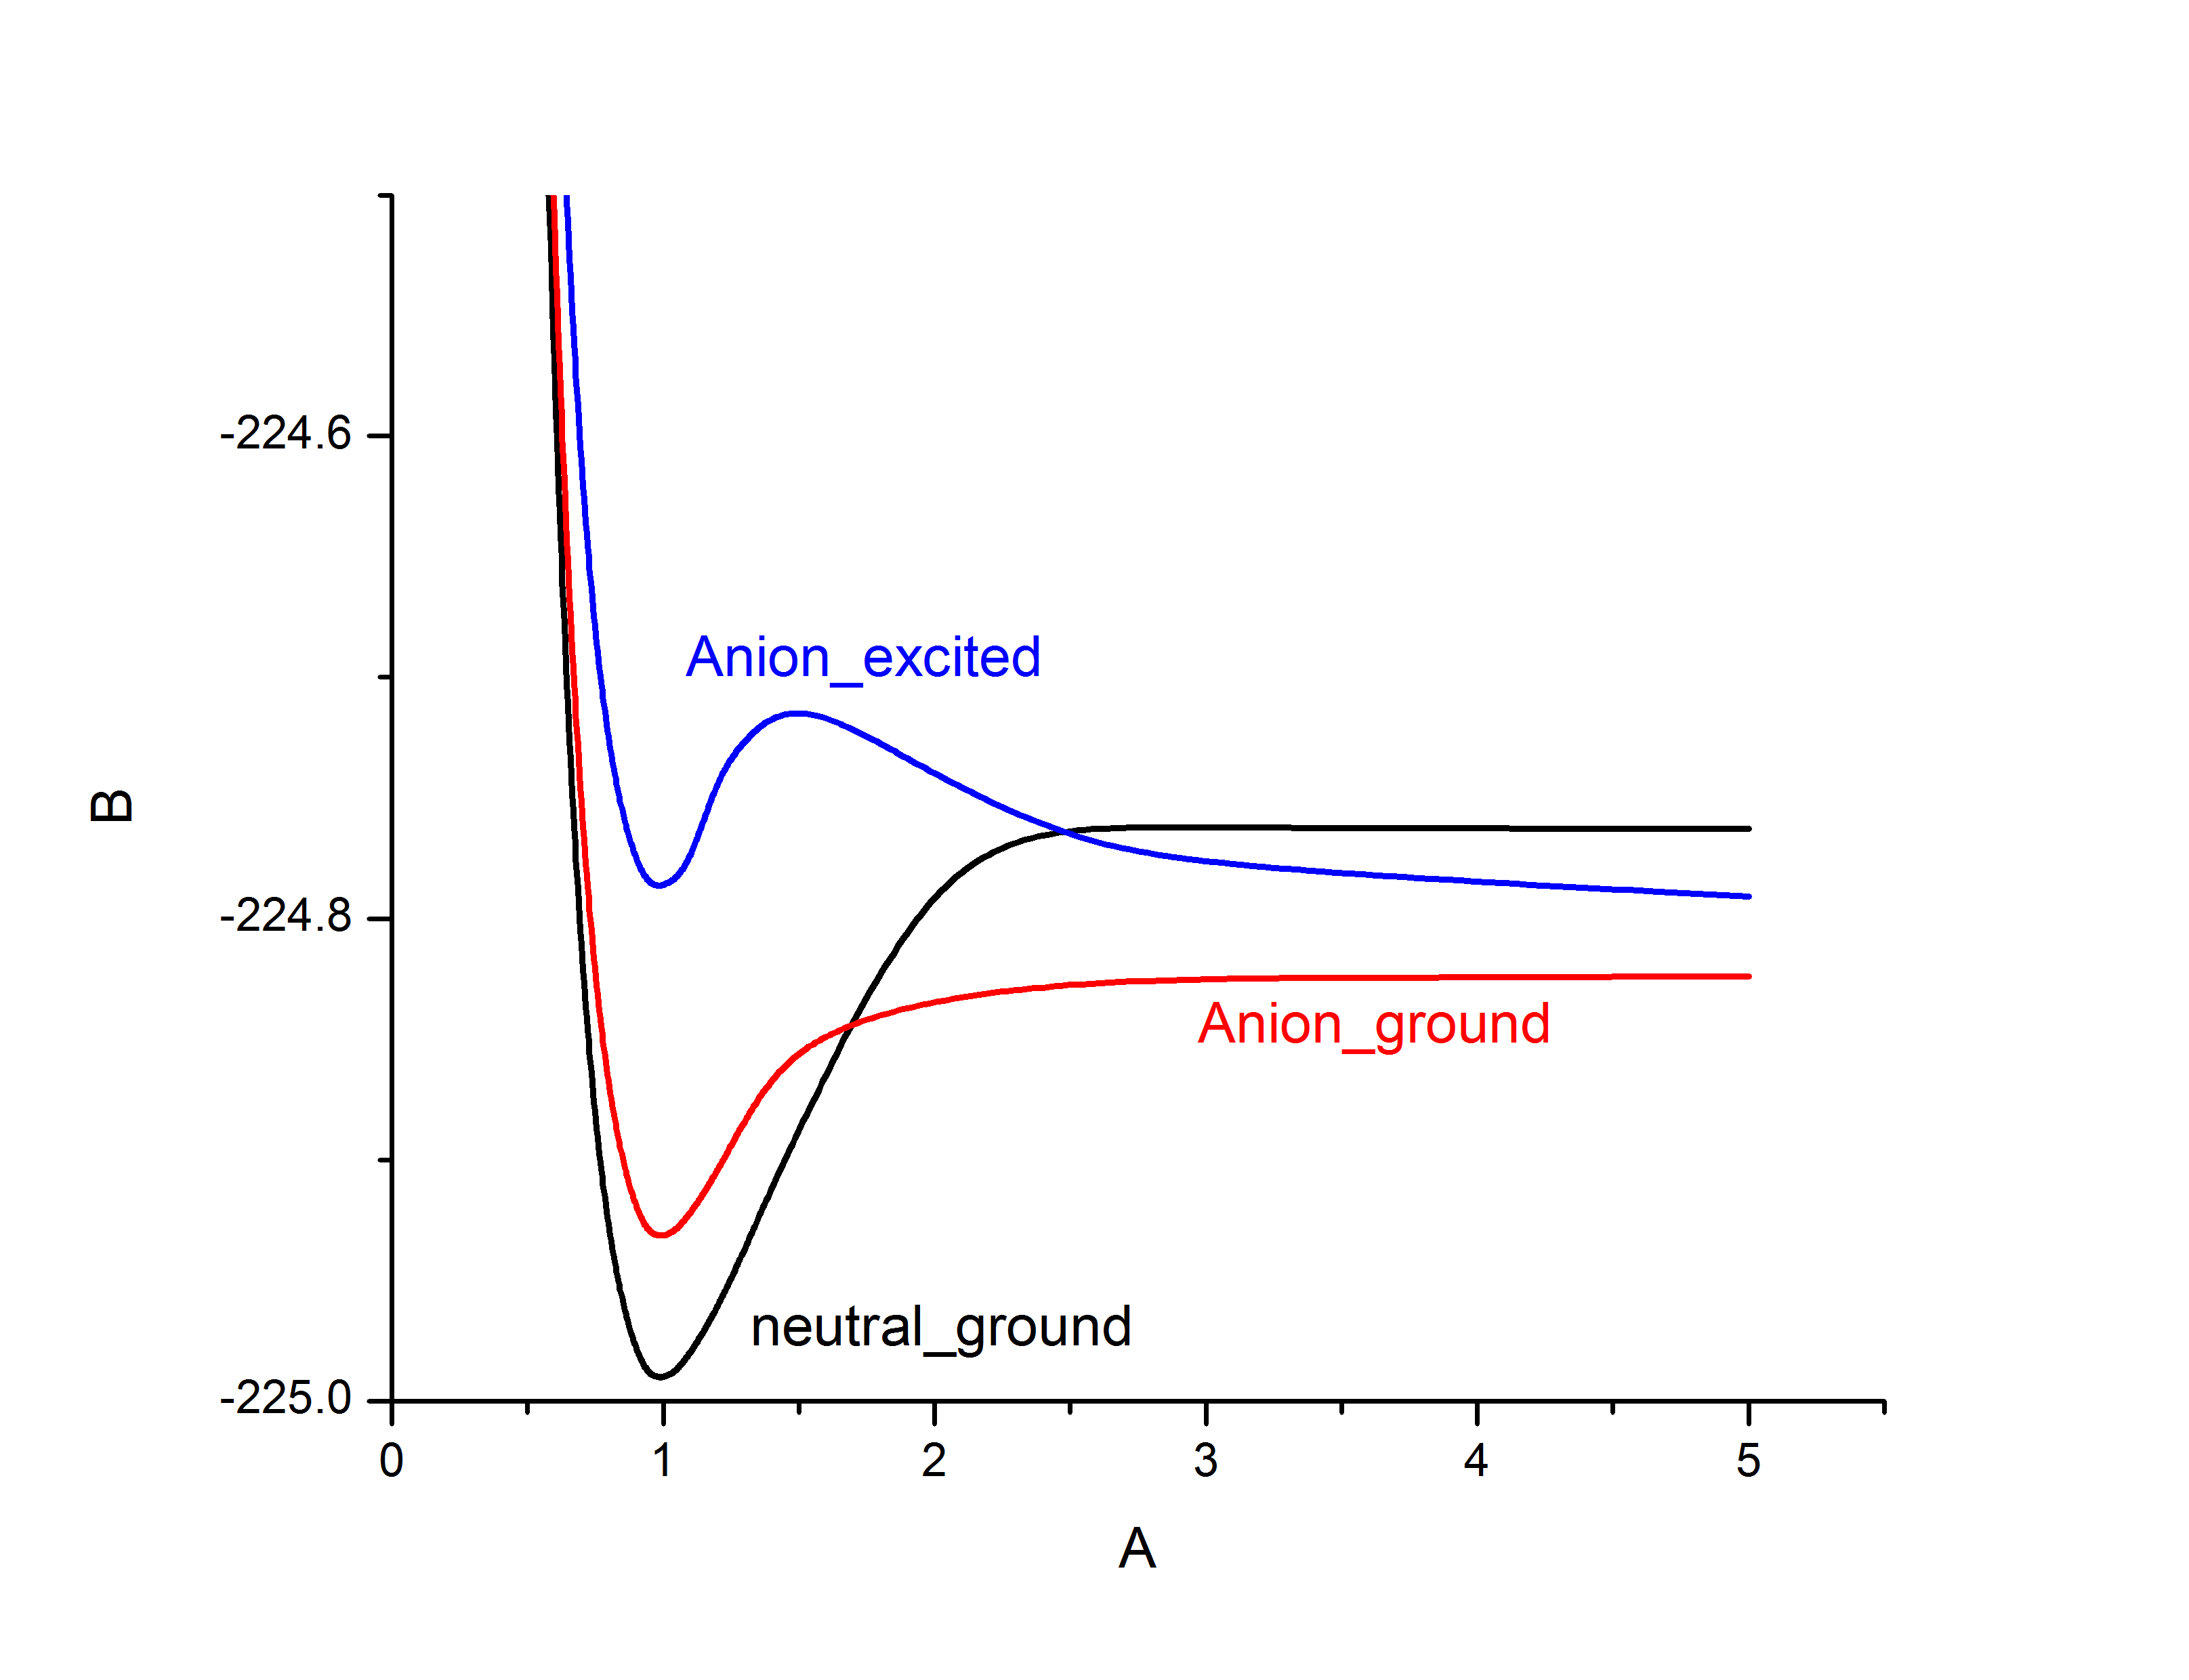
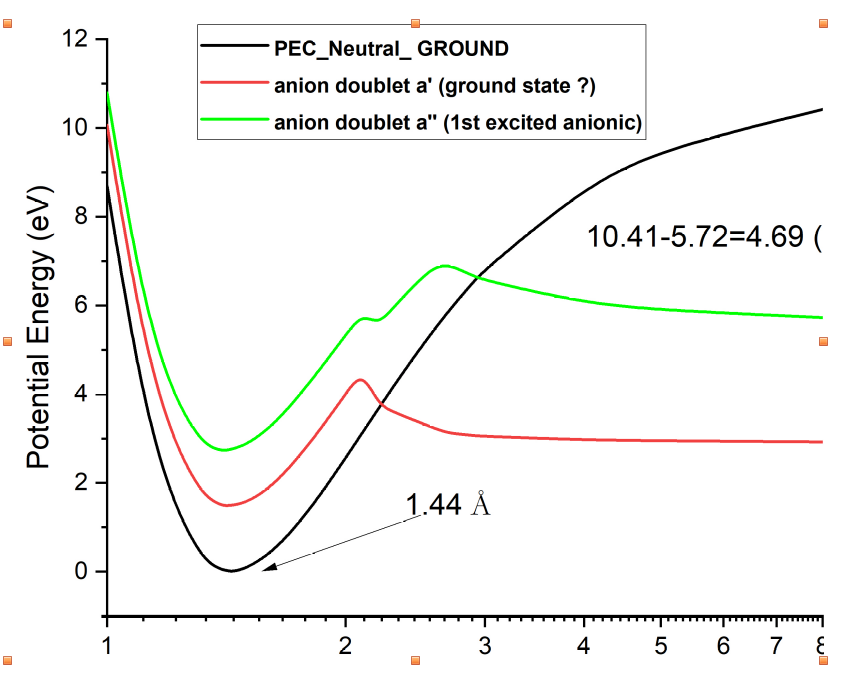
We have tried PEC calculations on some polyatomic molecules using MOLPRO/CASSCF. Each PECs contains 3 lines for neutral ground, anionic ground, and anionic excited state.
By just looking at the PECs, we have noticed some peaks in the anionic curve in all molecules, around after Req (equilibrium distance of that bond).
So, my confusion is that, why and what causes these peaks and what is the significance of peaks in PEC curves?
For reference, I'm attaching some of the PECs.
Thanks in advance
Sagar Vadhel
Mar 7, 2023, 3:20:34 AM3/7/23
to molpr...@googlegroups.com
--
You received this message because you are subscribed to the Google Groups "molpro-user" group.
To unsubscribe from this group and stop receiving emails from it, send an email to molpro-user...@googlegroups.com.
To view this discussion on the web, visit https://groups.google.com/d/msgid/molpro-user/5f9b6bd0-b135-4521-81b5-704626a9f2c4n%40googlegroups.com.
Sagar Vadhel
Mar 14, 2023, 6:34:32 AM3/14/23
to molpro-user
any answer?
Reply all
Reply to author
Forward
0 new messages