Help to understand clustering results
31 views
Skip to first unread message

Danilo Nunes
Aug 2, 2022, 5:30:00 PM8/2/22
to MOA users
I'm using the CluStream algorithm with the following parameters:
k = 5; micro-clusters number = 100The stream analysed is the electricity dataset, it contains 2 class
And the "decay horizon" for the stream = 1000
I was studying the source code of "purity" measure, in its calculus it's used a "MembershipMatrix" class that shows where each data was clustered, using the probability inclusion of the clusters.
Also, in this calculus has a extra clusters for data that was NOT included in any of the real k clusters
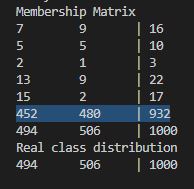
In the picture above, the highlighted in blue represents the extra cluster
It contains the most data of the stream window, and this happens for the entire execution
Is this a bad result?
If the answer is "yes", what should I do to get a better result?
I'm very confused to understading this
Thank you so so much
It contains the most data of the stream window, and this happens for the entire execution
Is this a bad result?
If the answer is "yes", what should I do to get a better result?
I'm very confused to understading this
Thank you so so much
Danilo Nunes
Aug 2, 2022, 7:32:36 PM8/2/22
to MOA users
Edit: Calculus = Calculation
Sorry for my poor english skills
Sorry for my poor english skills
Reply all
Reply to author
Forward
0 new messages