Graphics of functions
47 views
Skip to first unread message

ebarbosa
Aug 24, 2016, 11:25:49 AM8/24/16
to MIT App Inventor Forum
Hello!
I need an app to plot graphs of functions that are defined by
the user, in a text box. And that supports any exponent (x^7, for
example). Something like done with the Winplot software.
I'm sending a picture illustrating what I want. Is it possible do it with App Inventor? Thanks.


Taifun
Aug 24, 2016, 11:55:38 AM8/24/16
to MIT App Inventor Forum
see one of the following threads https://groups.google.com/forum/#!searchin/mitappinventortest/graph$20canvas
Taifun
Trying to push the limits of App Inventor! Snippets and Tutorials from Pura Vida Apps by Taifun.
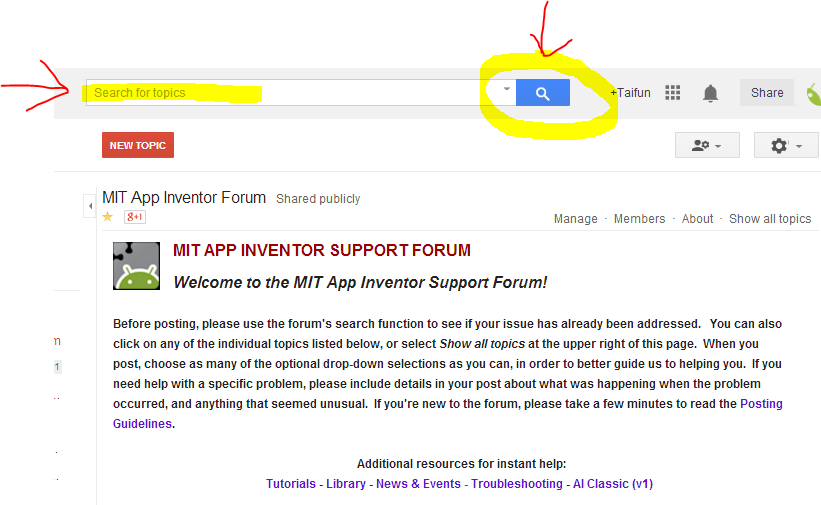
Advice: Before posting, it's a good idea to search in this forum. Many others have likely run into problems similar to yours. How to search see screenshot.
ebarbosa
Aug 30, 2016, 9:01:25 PM8/30/16
to MIT App Inventor Forum
Thanks.
Many answers in the forum indicate this site: Canvas Graph ... an expert AI2 tutorial. But he is offline..

Abraham Getzler
Aug 31, 2016, 1:28:36 PM8/31/16
to MIT App Inventor Forum
See the Charts and Graphs section of this FAQ for 2 samples.
If you find better samples, tell us and we'll add them.
ABG

Scott Ferguson
Sep 1, 2016, 2:08:05 AM9/1/16
to mitappinv...@googlegroups.com
Here is an example with sine, cosine and tangent.
Abraham Getzler
Sep 1, 2016, 2:28:34 PM9/1/16
to MIT App Inventor Forum
Reply all
Reply to author
Forward
0 new messages