Google gauge charts in AI2 - possible!?
3,909 views
Skip to first unread message

Gerard Bucas
Jul 13, 2019, 2:27:53 PM7/13/19
to MIT App Inventor Forum
Hi guys,
I would like to be able to display a Google Gauge chart into my AI2 app! :)
Is there a way to do this?
Data point for "gauge" comes from a BLE device & is already available in global variable in app.
Thanks!
Gerard

TimAI2
Jul 13, 2019, 2:44:31 PM7/13/19
to MIT App Inventor Forum
No reason why not....
Display in webviewer
You will need to create an html page (stored locally on app) and use the webviewstring to pass the data to it
App will need web/internet access for it to work
TimAI2
Jul 14, 2019, 5:44:39 AM7/14/19
to MIT App Inventor Forum
You may also wish/need to understand this:

Taifun
Jul 14, 2019, 8:22:11 PM7/14/19
to MIT App Inventor Forum
you might be interested in the Gauge Extension by Andres Daniel...
Taifun
Trying to push the limits of App Inventor!
Snippets,
Tutorials and
Extensions from
Pura Vida Apps by
![]() Taifun.
Taifun.
Gerard Bucas
Jul 15, 2019, 7:57:31 AM7/15/19
to MIT App Inventor Forum
Thanks Tim,
Will give it a shot. :)
Why would the app need internet access even if the only "url" (= html page file) being accessed is locally stored?
Is this "simply" a requirement for the web viewer to even load/work?
Curious...!
Thanks
Gerard
Gerard Bucas
Jul 15, 2019, 7:58:54 AM7/15/19
to MIT App Inventor Forum
Hi Taifun,
Thanks - looks VERY interesting - much appreciated!
Will definitely explore this.
Regards
Gerard
TimAI2
Jul 15, 2019, 9:55:23 AM7/15/19
to MIT App Inventor Forum
Yes, it is for the gviz google magic to work.
Message has been deleted

Chris Ward
Jul 15, 2019, 11:34:38 AM7/15/19
to mitappinv...@googlegroups.com
...Actually, you can use Google Charts without an internet connection, you can download the javascript file and add it as an asset to your App (HTML file is also stored as an asset).
I have just re-cycled Google's example HTML file, works great with their fake values :) Debug APK tested.

Chris Ward
Jul 15, 2019, 11:37:20 AM7/15/19
to MIT App Inventor Forum
... and you can DIY your own charts, using the Canvas for example.
Gerard Bucas
Jul 15, 2019, 1:55:01 PM7/15/19
to MIT App Inventor Forum
Niiiiice…!
Duly impressed... :)
Gerard Bucas
Jul 15, 2019, 2:55:16 PM7/15/19
to MIT App Inventor Forum
WOW - even more impressed..!
Learnt a LOT from you today...! :)
Observations:
1. I had to change the path for loader.js in the GoogleChart.html. Guess you also did that & wanted to make sure I know what I am doing! ;)
2. Works like a charm although I noticed that webview still requires Internet to be available for it to work (as Tim also pointed out). No problem for me but just wanted to mention that.
Question:
Is there a way to pass parameters to that HTML file? Only way I can think of is reading file (easy) and maybe doing a "replace text" of the "chart value" (& maybe max & min for chart) with my latest data value(s). Then writing file back & refreshimg webview.
Is there a simpler way...!?
Thanks again!
Regards
G
Chris Ward
Jul 15, 2019, 4:10:42 PM7/15/19
to MIT App Inventor Forum
Hi Gerard
Did you not try the HTML + js files that I posted? Definitely does not need an internet connection!
It's easy to pass values to the HTML file, but if doing so, the file must be outside of the App Assets, on virtual sd. The App can move the files to it's own sd folder as a one-off on first time use.
Read the App Inventor help on passing values to an HTML page, it's a simple piece of javascript.
Gerard Bucas
Jul 15, 2019, 4:44:22 PM7/15/19
to MIT App Inventor Forum
Chris,
Of course I used those files!
But when I switch off my WiFi on phone it no longer works.
Surely yours must behave same!?
G
Chris Ward
Jul 15, 2019, 5:33:06 PM7/15/19
to MIT App Inventor Forum
That's strange Gerard - have you changed something in the HTML file?
.png?part=0.1&view=1)
Chris Ward
Jul 16, 2019, 5:36:22 AM7/16/19
to MIT App Inventor Forum
Hi Gerard
Great start! There are other chart HTML + js examples on the Google site too :)
Gerard Bucas
Jul 16, 2019, 6:18:50 AM7/16/19
to MIT App Inventor Forum
Hi again Chris
I still have one issue that I am not happy about.
Please run the app (from .aia attached earlier). You will notice that the image of the chart (in the webviewer) allows the user to scroll/swipe both vertically & horizontally , which means the chart image can actually be scrolled off the screen by the user.
How do I stop that behavior (ie: DISABLE the scrolling of the webviewer?).
Maybe the HTML file needs to be set to exactly the right dimensions (so it can't be scrolled by webviewer) but I have tried a few things but can't get that to make any difference.
So I really want to have a static size of the chart image that cannot be MOVED by the user.
Any way to do that?
Thanks!
Gerard
Chris Ward
Jul 16, 2019, 6:32:43 AM7/16/19
to MIT App Inventor Forum
Hi Gerard
In the HTML file is this view port definition, necessary for smartphones:
<meta name="viewport" content="width=device-width, initial-scale=1.0, minimum-scale=0.5, maximum-scale=10.0, user-scalable=yes">
I think this little change might deliver what you need:
<meta name="viewport" content="width=device-width, initial-scale=1.0, minimum-scale=0.5, maximum-scale=10.0, user-scalable=no">
Gerard Bucas
Jul 16, 2019, 6:51:26 AM7/16/19
to MIT App Inventor Forum
Thanks Chris,
That took care of the vertical scroll but the horizontal scroll still has the same problem (ie: chart can be scrolled off screen).
I tried to add a height constraint as well but that didn't help1 :(
Tried these two:
<meta name="viewport" content="width=device-width, height=device-height, initial-scale=1.0, minimum-scale=0.5, maximum-scale=10.0, user-scalable=no">
and
<meta name="viewport" content="width=1025px, heigth=308px, initial-scale=1.0, minimum-scale=0.5, maximum-scale=10.0, user-scalable=no">
but the horizontal scroll stays the same no matter what I do!
Help...! :)
Thanks!
Gerard
Gerard Bucas
Jul 16, 2019, 7:22:34 AM7/16/19
to MIT App Inventor Forum
OK - figured it out!
Had to set it to this (overflow-x & overflow-y constraints).
<meta name="viewport" content="initial-scale=1.0, minimum-scale=0.5, maximum-scale=10.0, user-scalable=no, overflow-x=hidden, overflow-y=hidden">
Seems OK now!!
Regards
G
Chris Ward
Jul 16, 2019, 7:42:26 AM7/16/19
to MIT App Inventor Forum
Hi Gerard
Beat me to it :)
For HTML, CSS, Javascript etc, the best place to go is: https://www.w3schools.com
Gerard Bucas
Jul 16, 2019, 12:29:47 PM7/16/19
to MIT App Inventor Forum
:)
I also looked into that whole "issue" of whether or not one can load a chart without accessing the internet. The way it works is:
1. You need to be connected to the internet initially so that the google.charts "package" is downloaded from google. If you don't have internet access at initial load time, the chart you need will NOT get loaded. So if you switch off WiFi (or whatever way you are connected to the Internet) BEFORE you load the HTML file (eg: with Set HomeURL for WebViewer as we do), you will never see your ANY charts!
2. AFTER that initial package has been loaded (by: google.charts.load('current', {'packages':['gauge']}); in the HTML file), THEN you no longer need access to the internet & chart values can be freely changed (& charts re-loaded/rendered) without access to the internet. So you can switcj OFF WiFi AFTER the first HTML file is loaded & installed the package(s) you need.
3. Here are the "terms of service" from the Google Charts website:
Gerard Bucas
Jul 16, 2019, 2:35:14 PM7/16/19
to MIT App Inventor Forum
One last question/issue & we can finally close this..! :)
I need to know if there was NO internet connection when the HTML page is initially loaded as the chart does NOT get loaded and I need to inform user as to reason (= no internet connection!).
I can't seem to figure out how to do this with the WebViewer control.
Do you know how to do this, so I can take the appropriate action?
Thanks!
Gerard.
Chris Ward
Jul 16, 2019, 7:06:41 PM7/16/19
to MIT App Inventor Forum
Hi Gerard
I can understand Google doing that, in fact it is one of the reasons not to use their services, because they come along later and charge you for them when they were originally free.
Strange thing is, my phone was working with the files I uploaded to this Topic and it was not connected to the internet (WiFi) or even Bluetooth.......
Never mind - I think it is actually much better to DIY your own gauge using the Canvas, an Image of a gauge that you have drawn to exactly suit your requirements, and a sprite to perform the job of the needle ("hand"). I'm going to do exactly that in the near future, using an Arduino microcontroller and a temperature sensor to keep an eye on the heat of a 3D Printer enclosure.

Juan Antonio
Jul 17, 2019, 9:36:16 AM7/17/19
to MIT App Inventor Forum
Here a gauge extension (Thunkable):
Gerard Bucas
Jul 17, 2019, 10:53:22 AM7/17/19
to MIT App Inventor Forum
Hi Juan
Thanks - but I had already tried & seen that extension last week.
It is VERY basic and despite the fact that the images on the post show a radial dial, it seems to support only a single linear dial (which is very basic).
Last week I also had a look at the developer’s (Andres Daniel) other work/libraries for gauge charts & they are VERY impressive! Unfortunately those charts do not seem to be supported in the Thunkable/AI2 extension (at least not the one included in that post).
Let me know if I missed something...!?
I would love to use the Andres Daniel charts/dials in AI2 and am now looking at maybe doing it myself (without using an extension) using a local/static HTML file and uploading it (& support libraries) as AI2 assets. Then I can use the AI2 webview. It’s probably possible but needs more experimentation.
Regards
Gerard
Gerard
TimAI2
Jul 19, 2019, 10:33:23 AM7/19/19
to MIT App Inventor Forum
Did you find this on your travels?
There may be others, search for "javascript gauge".
You will need to download all the libraries (js files) required to your device to work off line
Gerard Bucas
Jul 19, 2019, 11:18:55 AM7/19/19
to MIT App Inventor Forum
Thanks Tim,
I hadn’t actually seen those. Looks interesting - will check it out in more detail.
Right now I am using Google Charts & I am very happy with - except for the fact that one needs initial internet access to load the first ‘image’ (after that you can update values without further internet access).
I am also looking at canvas-gauges ( https://canvas-gauges.com/ ) which also works without any internet access (so just from local downloaded JS library/loader).
Interesting stuff !!
Regards
Gerard
Chris Ward
Jul 19, 2019, 6:08:52 PM7/19/19
to MIT App Inventor Forum
.... There is another, similar lib: Highcharts library. Looks nice but hugely expensive :(
Gerard Bucas
Jul 30, 2019, 11:05:07 PM7/30/19
to MIT App Inventor Forum
Quick update.
FYI:
I came across a Gauge Chart that does NOT require Internet and that looks & behaves EXACTLY like the Google Gauge Charts.
There seems to be no visible difference & works well! The "cost" is of course a bigger JS library that needs to be loaded (d3.min.js) - about 160KB larger that the Google loader.js BUT for that you get EVERYTHING working locally without any internet access.
See this link if anyone else is interested.
Another similar solution can be found at this link:
Regards
Gerard
Chris Ward
Jul 31, 2019, 6:24:43 AM7/31/19
to MIT App Inventor Forum
Hi Gerard!
Thanks for sharing, I know I will find D3.js useful and I'm sure a lot of others will too.
I'm still going to try to DIY charts with native App Inventor - when I have the time that is :)

ABG
Jul 31, 2019, 10:38:29 AM7/31/19
to MIT App Inventor Forum
(added to Charts and Graphs section of FAQ)
ABG
Message has been deleted
Gerard Bucas
Jul 31, 2019, 1:55:25 PM7/31/19
to mitappinv...@googlegroups.com
Hi again Chris,
I agree with you. There is of course a downside to rendering it in HTML/webviewer as one needs to have a timer to 'check for change in value of webstring', which effects the perceived "response time". Would LOVE to do it in native AI2. So your little gauge.aia demo inspired me!
This morning I played with D3 some more and managed to use it to render the Google Gauge Chart equivalent "face plate" and needle! So I have the two elements needed to plug into your gauge.aia demo. The only thing I can't figure out is how to set the "centre point" of the needle so that it properly rotates on its axis.
So just need your help with that & we're done!!! :)
See attached .aia file
Thanks!
Gerard
Chris Ward
Jul 31, 2019, 4:32:28 PM7/31/19
to MIT App Inventor Forum
Hi Gerard
Running a back-up at the moment but I will take a look later tonight. Tomorrow I will not have an internet connection, the supplier is working on the cable network :(
TimAI2
Jul 31, 2019, 5:40:38 PM7/31/19
to MIT App Inventor Forum
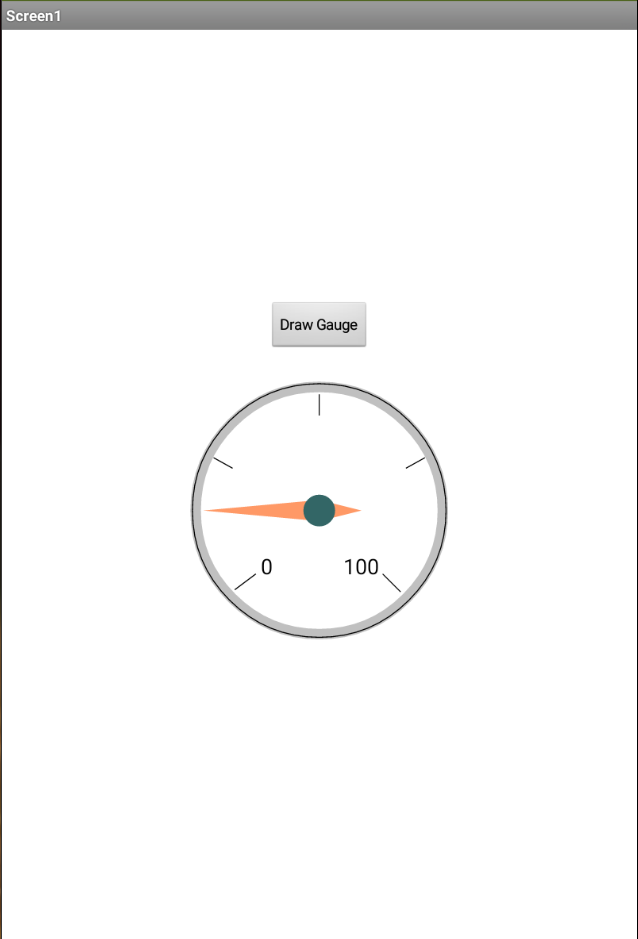
Here is a gauge chart (replicating what I see in google sheet for a gauge chart) made from a canvas. I attach also an analog clock aia made on a canvas, which may carry a few of the calculations needed to "automate the gauge"
It may be easier just to have a line for the pointer....
Gerard Bucas
Jul 31, 2019, 7:24:53 PM7/31/19
to MIT App Inventor Forum
Hi Tim
WOW - that drawgauge.aia is awesome!!
I have no idea though how you found/calculated the X,Y values (for example where you placed the 0 and 100 labels). Can you elaborate on that a little?
Also can't figure out how to create a reliable "point needle to X on dial"!!
For example, move point to 0 then 25 them 50 then 75 then 100.
Can you maybe explain that...?
I REALLY want to use this - shows GREAT potential (versus my current HTML/webviewer alternative).
So need you to teach/show me the basics here.
Haven't looked at the clock yet - will do so in a bit.
I can't use a simple line for a pointer/needle - not acceptable from am aesthetic point of view (your pointer in drawgauge.aia is perfect though - just need to leasrn how to move it! :) )
Regards
Gerard
Chris Ward
Jul 31, 2019, 7:36:24 PM7/31/19
to MIT App Inventor Forum
Hi Gerard
I have modified your file, see attached. The thing to remember is that all Sprites are rectangles and rotate at their centre. So, to get your needle graphic to rotate from the correct point, it actually needed it's background to be longer, such that the spindle (circle) of the needle is central to it's rectangle. Hope that makes sense. On my Samsung, your gauge is too wide and so it gets squished into an oval, hence I reduced it's size a little bit.
I think I can leave you in Tim's hands now :)
Gerard Bucas
Jul 31, 2019, 8:14:51 PM7/31/19
to MIT App Inventor Forum
WOW - Duly impressed - another "awesome" actually.
Its REALLY great that I can benefit from BOTH you AND Tim - each has a different angle (pardon the pun! :) ).
Bottom line is that I am now confident that this can be done in "AI2 native" (and I WILL do that!).
Let me digest all this great work/examples from both of you. Now that I also looked at Tim's CanvasClock.aia example I can see I need to brush up on my basic geometry (its been a loooong time! :) ).
Regards
Gerard
Gerard Bucas
Aug 1, 2019, 1:36:20 AM8/1/19
to mitappinv...@googlegroups.com
Chris,
OK - made some modifications & works really well now! See the attached aia file.
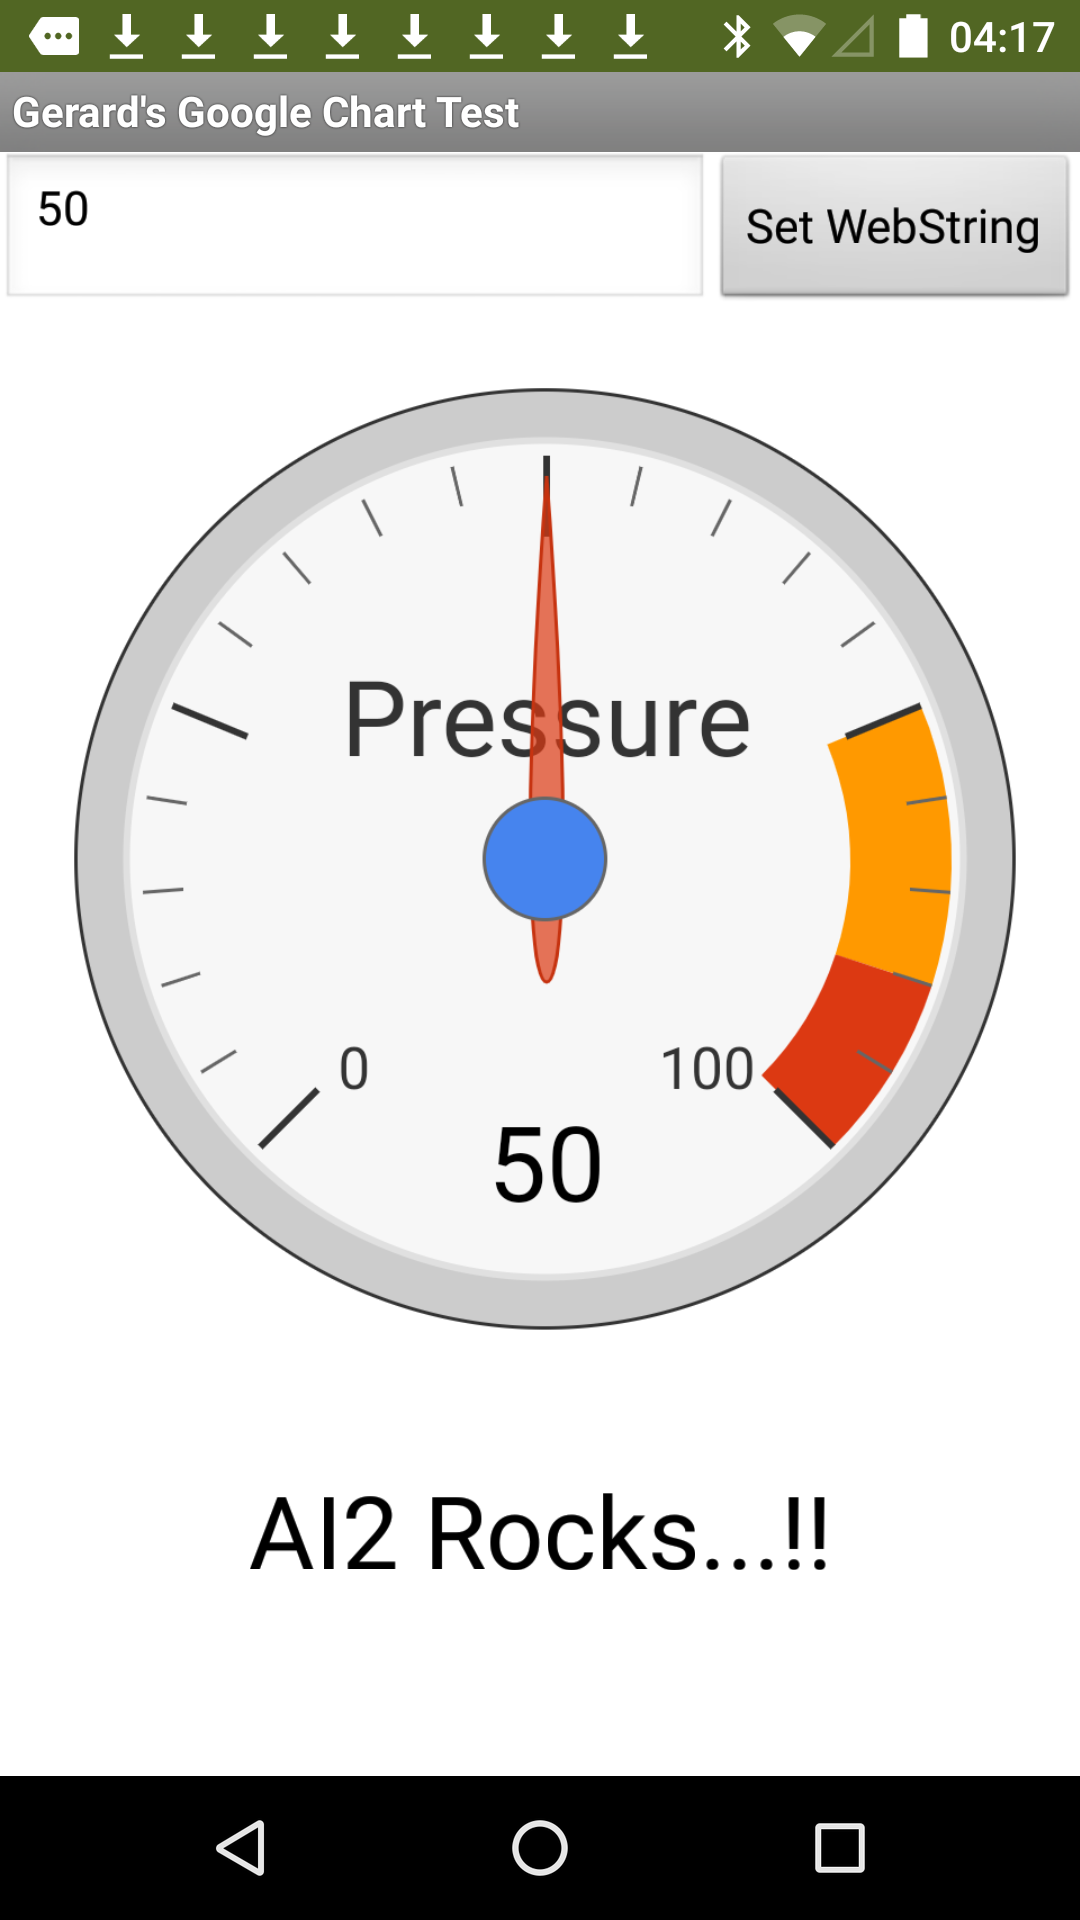
The only thing I can't get to work is drawing the "current gauge/pressure reading" on the faceplate (as is done in Google & D3 generated gauge charts),
So right now (in the attached aia) I show the "Pressure Reading" below the Gauge and I have disabled the "Draw Text on Canvas Block".
I need to redraw the Text Value on the canvas for each movement of needle BUT from what I can see there is no way to "Clear the previous value" and "draw" a new value, so it writes on top of the previous value and of course it becomes a mess! I am worried that there is no way to fix this unless you or Tim have some magic tricks that I don't know about...!? :)
This is actually a problem for me - mainly for "display space/layout" reasons in my app.
Any way to fix/do this?
Thanks!
Gerard
TimAI2
Aug 1, 2019, 3:41:16 AM8/1/19
to mitappinv...@googlegroups.com
To be honest, my effort was just a drawing, no programming (most of which I have forgotten to remember)
Work to do:
Coding:
Needle Position based upon value
Scale
Tickmarks
Features:
Add red/green arcs to the dial programatically
Dial motion from 0 to value on start
Value on dial - getting it centred is the fun part
Because the needle is a polygon, re-positioning is not trivial, and requires some geometry calculations. It still may be easier/better (for the geometry) to create an image of the needle and to rotate a sprite
Because everything on the canvas is drawn objects, the whole thing has to be redrawn for every change, therefore clear canvas then draw everything again
Chris Ward
Aug 1, 2019, 4:38:35 AM8/1/19
to MIT App Inventor Forum
Hi Gerard
I'm on the internet for just a few minutes before they pull the plug and update the cable network (outside in the middle of the road). Will be out of action for up to 24 hours so I'm going to switch the PC off and start the rebuild of my 3D printer kit so I can print in ABS :)
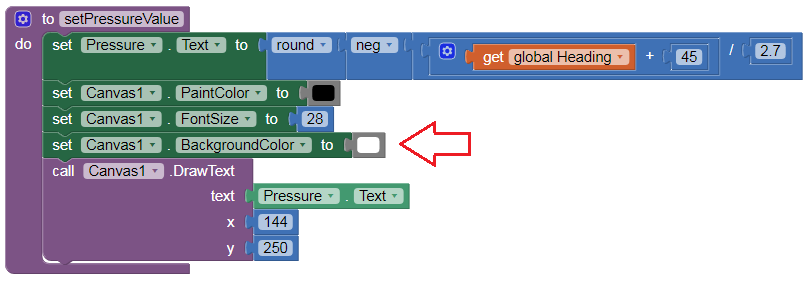
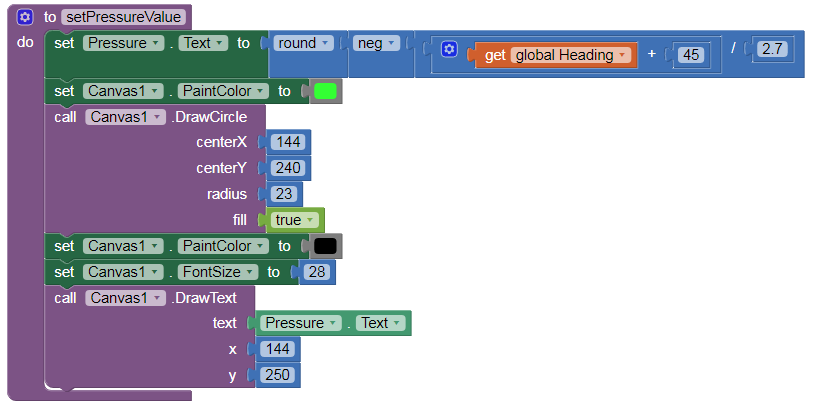
Before applying the new Value with DrawText, just draw a filled rectangle (background colour) over the previous value - in effect, erase the text.
Juan Antonio
Aug 1, 2019, 10:10:25 AM8/1/19
to MIT App Inventor Forum
Juan Antonio
Aug 1, 2019, 10:23:25 AM8/1/19
to MIT App Inventor Forum
Gerard Bucas
Aug 4, 2019, 1:48:17 AM8/4/19
to mitappinv...@googlegroups.com
Ok Chris & Tim (in alphabetical order..)
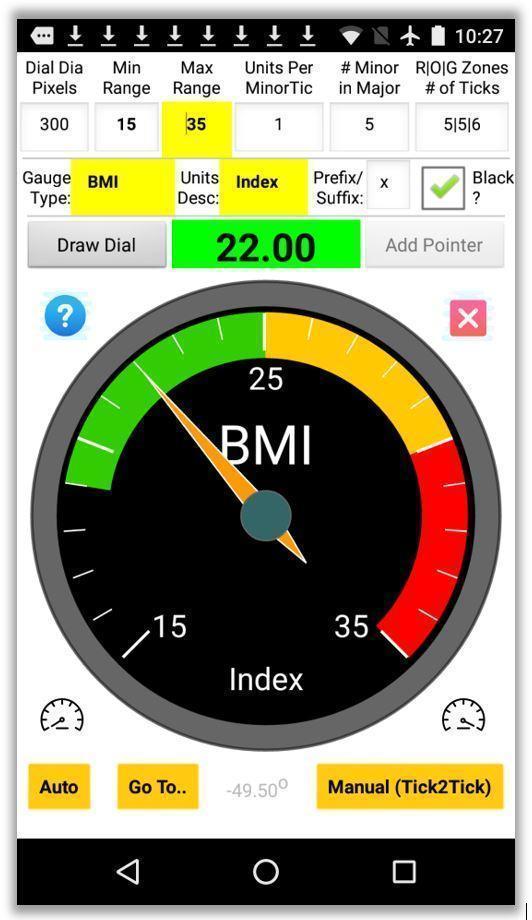
Here is the culmination of everything we have been discussion. Attached is the .aia file for an example of a very flexible "native AI2" Gauge Chart Generator that mimics the appearance of the Gauges in Google Charts. Everything is drawn & generated in AI2 and no external images or files are required. And of course no internet access is required (as is the case for Google Charts.
I hope it will be useful as a learning tool for many others as well - I certainly learnt a LOT from developing it over the past few days. My rusty high school geometry really came in useful!
Let me know what you think (and whether it was worth those drumrolls..!? :) )
Thanks again for the invaluable help from BOTH of you. You guys are really great & super responsive - amazing!
Enjoy
Gerard
Chris Ward
Aug 4, 2019, 8:21:29 AM8/4/19
to MIT App Inventor Forum
Hi Gerard
Fabulous work. The gauge graphic quality is very high, even on my oldest phone, which proves that DIY is better than images. I like your demo interface too. There are tiny bugs I have noticed - the pointer can go beyond the scale and it gradually becomes out of synch (alignment) with the ticks when running on auto for a while.
Gerard Bucas
Aug 4, 2019, 9:13:29 AM8/4/19
to MIT App Inventor Forum
Hi Chris
Glad you like it!!
The bugs you mention are not bugs I think.
In “auto” mode the pointer moves by a fixed 10 degrees as opposed to by meter ‘units’ - this is by design as it sort of shows more realistic readings & not ticks only.
The meter is allowed to go a little beyond the scale - this is also true for the Google Charts. It is actually useful in practice. For example in my real app where I use it, the meter i set the meter to -5 to when the BLE device I am reading from is not connected/active. Anyway ‘real’ meters actually go beyond scale (depending on type). It also demonstrates what happens if you throw high/low numbers at it - so in practice code must limit the ranges (although I am thinking of limiting the units in the meter code to -15 & 15 above max range (I think Google also does that - so pointer never goes beyond a certain point but the displayed ‘digital’ value is never limited. Anyway it’s not bad the way it is now I think.
Anyway I added those 3 ‘navigation’ buttons so anyone looking at the code can see how to ‘set’ the pointer in different ways if they wanted to use it in other apps. I thought it would be useful for others to learn from as oppose to just showing a ‘static’ meter example.
Yes - I love the ‘crispness’ on ANY device. The earlier method I tried - with a pre-rendered faceplate image - looked great on my Nexus 5 but REALLY lousy on a 8” Samsung tab1 tablet. Whereas this one looks great on both. So I am really happy with it.
Thanks again for the help & inspiration - that little crude gauge demo you sent me REALLY got me thinking as I had never used the AI2 canvas tools before & the fact that it has those sprites - GREAT stuff. AI2 never ceases to amaze me what one can do with it!!
Regards
Gerard
TimAI2
Aug 4, 2019, 2:08:27 PM8/4/19
to MIT App Inventor Forum
Well done Gerard :)
Some comments:
- Iron out the bugs as above
- Seek to make this more portable:
Create the blocks in one, or as a minimum two (one for building the gauge, one for placing/moving the pointer) procedures, with local variables for all the options
(Look at the dial/gauge options in google sheets for ideas if you want an options menu) - Suggest auto setting of tickmarks as per google sheets, majority of cases won't need to set their own, just start and end values needed
Gerard Bucas
Aug 5, 2019, 1:54:15 PM8/5/19
to mitappinv...@googlegroups.com
OK - Tim & Chris,
Here is V2 - this is as good as it gets - need to move on to other things...!! :)
I am now VERY happy with it & I claim it has no bugs now & a great looking UI (for a development tool app)!
Made some serious changes:
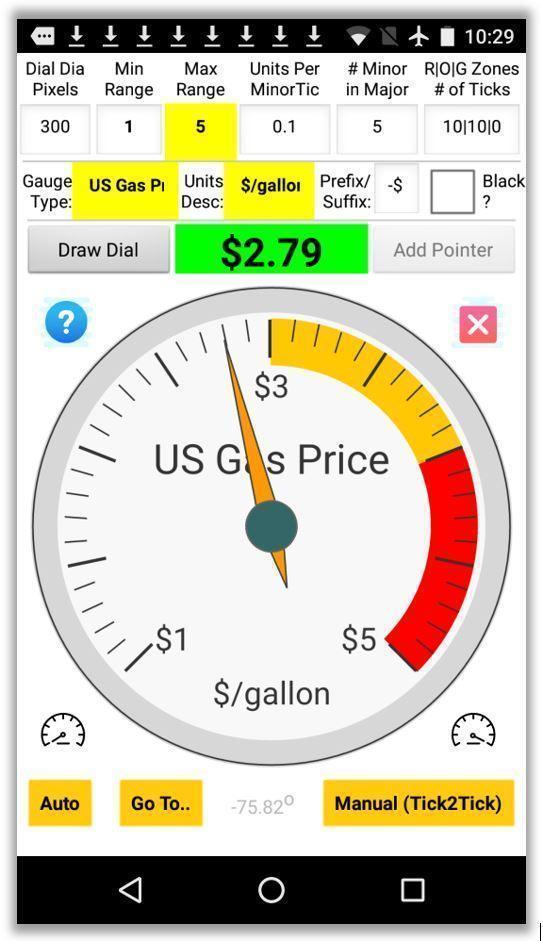
1. Add an option to allow the Dial faceplate to be rendered in either white or black (black is now default - more beautiful!)
2. The "default" faceplate now appears immediately when app is launched (visually MUCH nicer/obvious).
3. Cleaned up the UI as much as possible (personally I like it & most users will use default values on UI).
4. The "Minimum Range" can now also be set to whatever one needs (before it was fixed at zero). This was tricky!
There are lots of needs for Gauges with negative min Range (eg: Vacuum vs. Pressure, RSSI Signal Strength, feet above/below Sea Level, etc)
5. When you click on the "Auto" button, it now moves the needle one UNIT at a time (as opposed to tick at a time).
6. Added a new "LongClck on Auto" feature which will move needle one Tick at a time (similar to Tick2Tick in Manual mode but Automatic).
7. Cleaned up the code a LOT. Seperated the "validation of input parameters" from the "drawing" of dial & pointer functions. So it is much easier now to understand (or "lift") the "gauge generator" code to include in other apps (as I need to do!), where the parameters by definition do not need to be validated. So that should make Tim happy as well!! :)
8. Fixed the "bugs" reported by Chris:
a) The "Auto" & "Manual (Tick2Tick)" modes will no longer go "out of min/max range" - even though that was not a bad thing IMHO!! :)
b) The needle should NEVER get "out of sync" (ie: NOT "on Tick") in "Manual (Tick2Tick)" mode (or when you LongClick on "Auto" button).
c) So the only way to get the meter to go a "little" out of Range is to use the "GoTo" button and enter an out of Range Value to "GoTo". If the value entered is too far out of range, it will be adjusted to no more than 2 Ticks below/above min/max range (this is how realworld meters behave when the needle doesn't have a mechanical stop (as some don't).
This was a LOT of fun! Of course I couldn't have done it without the help of BOTH of you - so thanks again!!!
Until the next time....! :)
In the meantime Enjoy....
Best Regards
Gerard
Chris Ward
Aug 5, 2019, 7:45:24 PM8/5/19
to MIT App Inventor Forum
Hi Gerard
Having fun is what coding with App Inventor is all about :) Like the dark theme, very impressive!
Gerard Bucas
Aug 5, 2019, 7:52:09 PM8/5/19
to MIT App Inventor Forum
Thanks Chris - yes I was surprised myself how different/good it looks!
May even be good enough for ‘app of the month’!? 😉
Regards
Gerard
May even be good enough for ‘app of the month’!? 😉
Regards
Gerard
Gerard Bucas
Aug 20, 2019, 11:16:55 AM8/20/19
to mitappinv...@googlegroups.com
OK, Chris & Tim!
My final attempt to get your nomination for 'app of the month'!! ;)
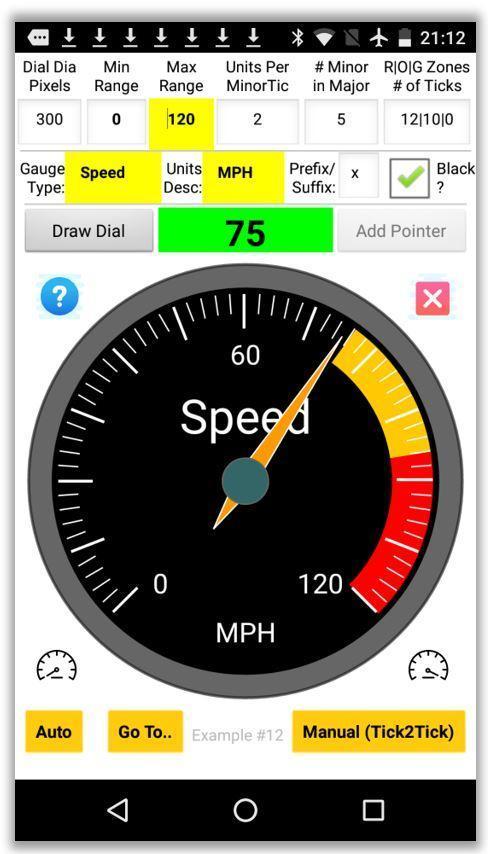
This is now the definitive Gauge (Analog Meter) Generator example/learningTool for Android,,,,!
Have a look it - when you run it check the 'Help" button (Question Mark in Blue Round Circle).
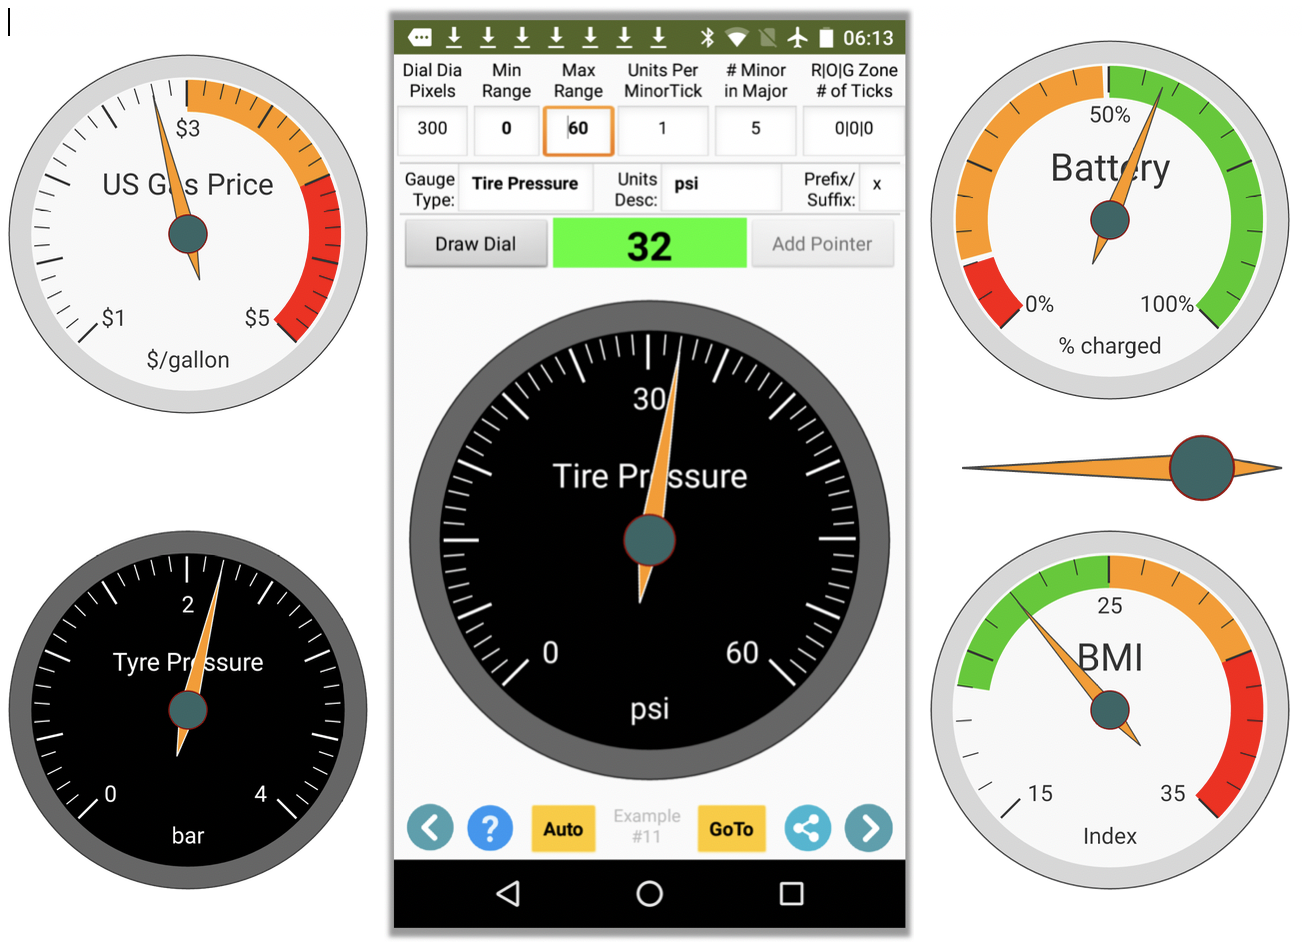
Key features are (also explained in Help):
1. Touch Centre of Pointer to toggle White/Black FacePlate.
2. Touch Right Half of Dial/Gauge FacePlate to see the Next "pre-Canned" Gauge Example (there are now 14 different examples!).
or Touch Left Half of Dial to go back and see the Previous Example(s).
or Touch Left Half of Dial to go back and see the Previous Example(s).
3. Three (optional) colored/coloured zones - which can be reversed (so Green, Orange & Red or Red, Orange & Green).
See Wifi Signal or Battery Charge Examples for reversed zones. Battery Example also shows the optional "gap" on either side of the Orange Zone.
See Wifi Signal or Battery Charge Examples for reversed zones. Battery Example also shows the optional "gap" on either side of the Orange Zone.
3. Tons of other fun features to play with...
4. Should be Very easy for anyone to connect to Arduino with BLE for Displaying an "Analog Meter" - which is what I needed it for myself.
It's also VERY easy to add additional examples to the list - or you can of course "roll your own" by changing any of the 12 input Parameters to create your own Analog Gauge/Meter/Chart on the fly.
Should be a great tool to teach others a LOT about AI2 features/techniques - I certainly learnt a lot myself from it.
Tested on Android versions 5, 6, 7 & 8.
Hope you guys like it as much as I do.....!? :)
Regards
Gerard
Chris Ward
Aug 22, 2019, 11:46:46 AM8/22/19
to MIT App Inventor Forum
Hi Gerard
A magnificent piece of work!
I'm sure a lot of people will use it - I will be one of them when I finally get to finish the construction of my 3D Printer.
The MIT Power Users do not have an "App of the Month" thing - we rarely see finished Apps, only problems and bugs :)
Gerard Bucas
Aug 23, 2019, 5:45:36 PM8/23/19
to MIT App Inventor Forum
Thanks Chris - glad you like it!
BTW: If you do in fact use it, please download the latest .aia (attached to my previous post) - I just fixed a minor bug & updated the .aia (same name so not obvious!).
Chris Ward
Aug 26, 2019, 6:54:55 PM8/26/19
to MIT App Inventor Forum
Hi Gerard
You can enter your App into App of the Month here:
Gerard Bucas
Sep 7, 2019, 9:40:27 AM9/7/19
to mitappinv...@googlegroups.com
Hi again Chris et al,
OK - I think it is finally ready for the gallery! (edit: It is in fact now in the AI2 Gallery, here: GaugeGenerator ).
Have now added the pointer animation "magic" learnt in my other thread (https://groups.google.com/d/msg/mitappinventortest/p2tW88Mi4hY/ZZlH175aAgAJ ) and one can now save the canvas (with or without pointer) and/or the pointer only.
In fact I used this app to generate the "byAI2+GB" faceplate & pointer (with diameter = 200) used in that thread to test/develop the pointer animation techniques. So both threads are closely related.
So let's close this thread as well! :)
Edit 23-Sep-2019: Updated to V3. Main difference is that pointer image is now exported in same pixel width as faceplate. This makes it easier to "place" the pointer picture as a sprite on the faceplate canvas (for other apps that want to use these exported images), as the "x" position will now always be 0 (y position of pointer is center on center).
Best Regards
Gerard
Chris Ward
Sep 8, 2019, 8:03:04 AM9/8/19
to MIT App Inventor Forum
Hi Gerard
Don't close this Forum Topic until your App is in the Gallery and a link to it is here.
Gerard Bucas
Sep 11, 2019, 7:27:11 AM9/11/19
to MIT App Inventor Forum
OK - finally submitted the "GaugeGenerator" app in the Gallery!
Here is the link: Gauge Generator App
Thanks to everyone for all the encouragement, help & inspiration!
This was a lot of fun...!
Now closing thread.
Regards to all.
Gerard

Italo
Sep 11, 2019, 12:07:45 PM9/11/19
to MIT App Inventor Forum
I would like to mention this tutorial to make an analog clock in App Inventor without using any sprites, just math for drawing the hands. Replacing the time data for any other number produced, you can use it as a gauge too.
Reply all
Reply to author
Forward
0 new messages