Inserting Data from CSV file into App to Draw Chart

3,555 views
Skip to first unread message
Assigned to ewpa...@gmail.com by steve....@gmail.com

zekrom fast

unread,
Jan 31, 2018, 10:50:46 AM1/31/18
to MIT App Inventor Forum

Hi guys,
I’m new in this forum.

I’ve got a problem on how we can insert data from our CSV file into our app by using the ChartMaker extension.

Because I got this error…

gnu.lists.FString cannot be cast to com.google.appinventor.components.runtime.util.YailList<

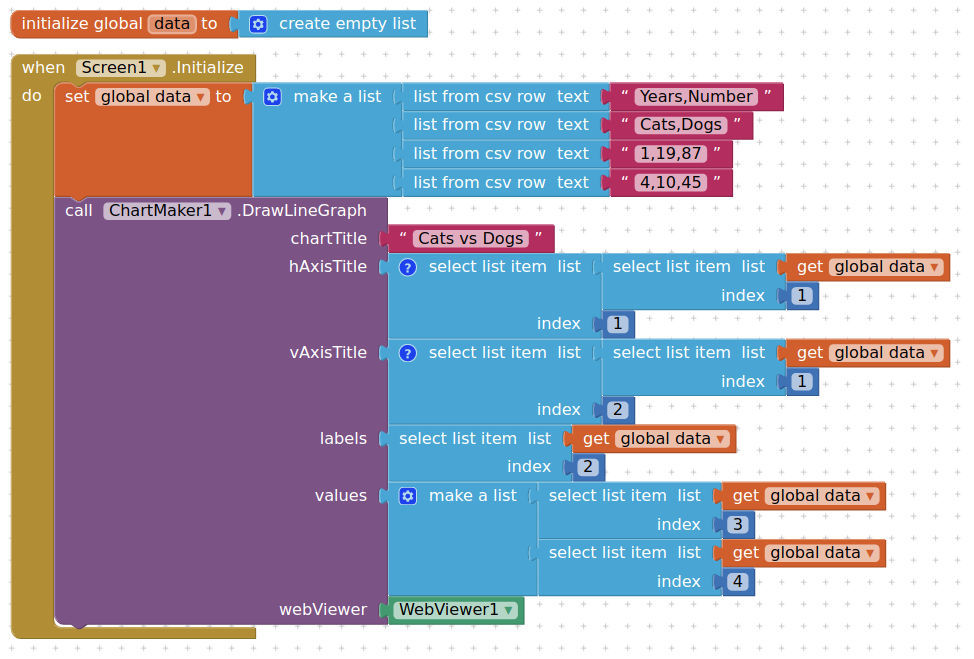
Here is my code, it sure display the data in the ListView, but it does not create the graph.

for this App, I’m using the ChartMaker Extension by Kate Manning and Emily Kager.

Can anyone discuss this with me?

Thanks.

SteveJG

unread,
Jan 31, 2018, 11:47:31 AM1/31/18
to mitappinv...@googlegroups.com
Extensions go stale if they are not updated for compatibility with the current App Inventor release (presently nb166).   I expect the error might 
result from changes in App Inventor not reflected in Manning/Kager's extension since your ListView correctly shows the data.


Perhaps one of the MIT staff will comment.

Regards,
Steve

zekrom fast

unread,
Jan 31, 2018, 1:20:34 PM1/31/18
to MIT App Inventor Forum
Thanks for the reply.
Yes, I'll wait for other comments.

Abraham Getzler

unread,
Jan 31, 2018, 1:37:16 PM1/31/18
to MIT App Inventor Forum
In the meantime, see the Charts and Graphs section of FAQ
for more options.
ABG

zekrom fast

unread,
Feb 2, 2018, 8:19:46 AM2/2/18
to MIT App Inventor Forum
Dear Sir Abraham Getzler,

Thanks for the option. 
I actually have used the  ChartMaker Extension by Kate Manning and Emily Kager as stated in the group.
And there is the problem I'm facing right now when inserting the data from CSV file into the app.

Hope we can discuss it here.

zekrom fast

unread,
Feb 2, 2018, 8:47:46 AM2/2/18
to MIT App Inventor Forum


I’ve tried removing the join text and the “\n” tag of the values field. The error is gone, but still, there is no data coming in. Just a blank page without data.

Below is the new code I’ve done.

Have you try the ChartMaker extension by Kate Manning and Emily Kager?

Abraham Getzler

unread,
Feb 2, 2018, 1:41:03 PM2/2/18
to MIT App Inventor Forum
Where is the place where you set the Web1 URL before the Web1.Get?
Show us that the URl works.
ABG

Message has been deleted

zekrom fast

unread,
Feb 2, 2018, 5:30:19 PM2/2/18
to MIT App Inventor Forum
I set the URL  in the Web1 properties as below.


zekrom fast

unread,
Feb 2, 2018, 5:42:56 PM2/2/18
to MIT App Inventor Forum

The URL is working nicely because the data has been displayed in the ListView, but it does not create the graph.

Below is the result in the emulator. Only the graph cannot be displayed.


Message has been deleted

TimAI2

unread,
Feb 3, 2018, 8:00:01 AM2/3/18
to MIT App Inventor Forum
Have had a look at Chartmaker, it all works fine using their examples

Created a list of lists from csv rows and used that variable to populate the chart and that also works


Suggest you look closely at the structure of the data coming in from the url, and ensure you are calling the correct data into values, that is what is causing the problem, i believe


zekrom fast

unread,
Feb 3, 2018, 8:14:16 AM2/3/18
to MIT App Inventor Forum
Do you test it in the real csv file? or just creating the data inside?

zekrom fast

unread,
Feb 3, 2018, 9:27:44 AM2/3/18
to MIT App Inventor Forum
Here is what I try again from your suggestion to look at my csv structure.

My data.csv structure has 2 columns and more than 10 rows.


Below are the code, result, and the error.


The error gives me a curious... 
Have I done a row and columns mistake?

TimAI2

unread,
Feb 3, 2018, 4:08:06 PM2/3/18
to MIT App Inventor Forum
I have been playing around with chartmaker on and off all afternoon, and to be honest, its behaviour is most peculiar. Does not want to accept a single set of data, and I am yet to comprehend the relationship of the numbers applied as values to what is displayed on the chart. Other than "plain text" values it won't accept a variable as a list of a length greater than 3.

I do a lot of work with google visualizations which generates the chart, the inputs don't make any sense to me in that regard. 

I believe it may be better to try Juan Antonio's chart.js option as found on the FAQ

In the mean time i will see if I can get the developer to provide further explanation of how it is supposed to work.

TimAI2

unread,
Feb 3, 2018, 5:58:32 PM2/3/18
to mitappinv...@googlegroups.com
Hey Hey! I figured out what is going on.

The values section is looking for pairs of values, or an identifier of a series then the values for each series, so for your chart it would be as it looks in the csv.
So in long hand format it would look like this:


All that is needed is to remove the first row (value/Temp) then it works.

I made up a csv based upon the layout you posted, imported that as an asset, then read it in with a file component:


and hey presto, a chart:


(this is a screenshot from my emulator)


Hopefully you can figure it out from here....


{EDIT} example csv file added


tempstest.csv

Abraham Getzler

unread,
Feb 3, 2018, 6:20:23 PM2/3/18
to MIT App Inventor Forum

zekrom fast

unread,
Feb 3, 2018, 6:51:08 PM2/3/18
to MIT App Inventor Forum
TimAI2,
Yes, it works. Thank you.

By the way, I just want to make a clarification about the table in CSV and how to use the chartMaker.

What we are doing right now is to get the data from csv file like the structure below. So we can just call in by row 'without' a 'specific' column value.


Say that I want to call a specific row-column value [column C, row 10] and at the same time we still want the value of 'value/TEMP'. How can we do that?
Because from the discussion, I learn that the MIT app inventor in the 'List' block code has no 'list from csv column text' code.
So, how can we achieve to call a specific row-column value like [column C, row 10]?

Hope we can discuss further.
Thanks.

TimAI2

unread,
Feb 3, 2018, 8:31:09 PM2/3/18
to MIT App Inventor Forum
Your csv file file is structured as a two dimensional array of rows and columns, therefore every "cell" has a reference.

Say we put the table into an array called "temptable"

In javascript i would reference the first row and colum cell (the one with "value" in it) as temptable[0][0]
(javascript arrays start at 0)

So your column C,row 10 would be: temptable[9][2]

Much the same applies in AI2 except the indexes start at 1

To get the value from the array (list of lists) we simply have to figure out what the indexes are that we need.
Now the data we have been working on only has two columns but I will use this as an example to get the value of Column B, Row 10

The dataset looks like this:

value,Temp
1,37
2,45
3,41
4,38
5,43
6,37
7,41
8,41
9,43
10,37
11,35
12,31

I first get the "Temp" string from the first row,second column
then get the number value from the tenth row,second column
to finish off some fancy string work to add the two together and show the degrees sign


 If you want to get really clever it is possible to use variables to set the indexes, and /or iterate through all the values.

zekrom fast

unread,
Feb 3, 2018, 11:16:26 PM2/3/18
to MIT App Inventor Forum
Yeah, you're right.

I have to use the variable in order to operate the cell.
Then I can select what column or row that I need, and call it as a string by using 'join' block.

Thank you TimAI2, Abraham Getzlerand SteveJG. 
It is good to have a discussion here.
(y)
Message has been deleted

zekrom fast

unread,
Feb 4, 2018, 2:05:49 AM2/4/18
to MIT App Inventor Forum
Hi, sorry for disturbing again.

I've tried to key in the date value in the graph as 'days'.
But it seems not functioning because it doesn't display the data without error.

Previously we test it as the single data in a cell. But now, we want to get the date with the format of (dd/mm/yyyy).


The date actually comes from the google script where I used to make a connection with my IoT device.
Sorry, maybe we can discuss further.
Thanks.

zekrom fast

unread,
Feb 4, 2018, 2:08:42 AM2/4/18
to MIT App Inventor Forum
As you mention above (10 hours ago),

Does not want to accept a single set of data, and I am yet to comprehend the relationship of the numbers applied as values to what is displayed on the chart.

So, I guess it will not be a problem for the chartMaker to get that kind of data.

Correct me if I'm wrong. 

TimAI2

unread,
Feb 4, 2018, 4:57:31 AM2/4/18
to MIT App Inventor Forum
It can get the data to a line graph, but it doesn't / won't display the date as a readable date, no matter what I try.

With a bit of work I was able to display readable dates using the Chartmaker bar graph


The chartmaker extension, whilst clever, is not sufficiently sophisticated to be able to cope with date formats and representing them on a chart. There are similar issues when pulling date data through from google sheets onto google visualizations (which underlies chartmaker), and I have routines in the javascript to reformat the dates in order that they display correctly. If I get time (not today) I may have a look at developing a more feature rich option.


Enjoy appinventing


zekrom fast

unread,
Feb 4, 2018, 9:25:03 AM2/4/18
to MIT App Inventor Forum
Thanks.

I'm looking forward to your ideas.
But in the meantime, I also should work on getting it too.

Hopefully, these efforts will help other apps inventor.

zekrom fast

unread,
Feb 11, 2018, 12:22:40 AM2/11/18
to MIT App Inventor Forum
Hi everyone,

Regarding the matter of Chartmaker that cannot send/parse the date from csv to make it in the graph, 
I'm still not able to find a way.

I've tried to make it simple and just view it in the list view, and it is fine to parse the date information.
As for now I try to make it 3 column, so the code is as below.


From my observation (for the listview), although it can parse the date but it cannot parse the time.


So, in conclusion,
1) The work to make the Chartmaker display the date is still not success.
2) Curious about displaying Timestamp (date & time)-as above picture of table.

Can anyone discuss about these matter?

Thank you.

TimAI2

unread,
Feb 11, 2018, 5:20:28 AM2/11/18
to MIT App Inventor Forum
AI2 is probably pulling through the formatted value so you just get the date?

Try converting to an instant then formatting as time?


Or change format on spreadsheet to present the original timestamp which has date and time

zekrom fast

unread,
Feb 11, 2018, 9:39:17 PM2/11/18
to MIT App Inventor Forum
I've tried your idea last night.

I'm getting errors like below:

1) Error in screen graph (ChartMaker)


Below is the code that I run according to the suggestion.

[graph code]


The flow of this work:
1) Getting data from IoT device.
2) Post the data to the google spread sheet by using the google script code.gs that automatically provide the date by using [new.Date()]
3) display the data in graph using app inventor.


As for this morning, I've tried to change the way I'm calling the date in the script code.gs by using [Date()] as stated in the link below.

The error is as below: (I got a blank graph), the app code is the same app code as above.


For this case I suspect the format pattern of date is different from we code in the clock block.

If you can see the 'value' port in the ChartMaker, I'm using 'make a list' block to connect the clock port.
Is it correct?  

zekrom fast

unread,
Feb 11, 2018, 9:49:56 PM2/11/18
to MIT App Inventor Forum

Oh yah, before I forget...

Or change format on spreadsheet to present the original timestamp which has date and time

When I'm using [new.Date()] code in google script to send the data in google spread sheet, actually it comes with date & time.
But in the spread sheet it can only display the date in the each cell of Timestamp, like [2/12/2018].

And,

When I'm using [Date()] code in google script to send the data in google spread sheet, it can display the whole date & time in each cell.

So, I'm confuse and suspect many possibilities.

Maybe someone can narrow the possibilities.
Hope for discussion.

TimAI2

unread,
Feb 12, 2018, 4:49:02 AM2/12/18
to MIT App Inventor Forum
Using the methods i described further back up the thread, you will need to take the data apart, format the date and time, then put the data back together. You can't just make a list like you have, as 'global data' now becomes a sub list, and that is why you get the errors. So as you did use indexes to extract the items in each column of your data. Then you may wish to do things twice on the date number, once to get the date, and then again to get the time, adding a column to your data in the process. Then figure out exactly which columns you want to send as values to chartmaker.

Good news is the times are coming through, so on the spreadsheet it is just a formatting issue (you may need to delete that column and start with a new one, as once google sheets gets its hands on a date format, it tends to stick with it)
Reply all
Reply to author
Forward
0 new messages