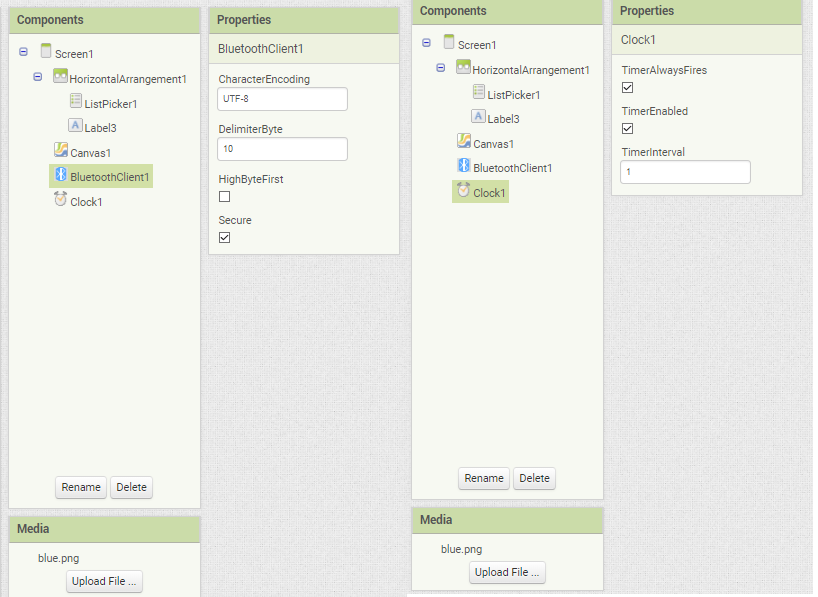
ECG circuit(analog data)-Hc06- Arduino-Chart
423 views
Skip to first unread message

Bahattin Gok
May 12, 2019, 6:39:44 AM5/12/19
to MIT App Inventor Forum
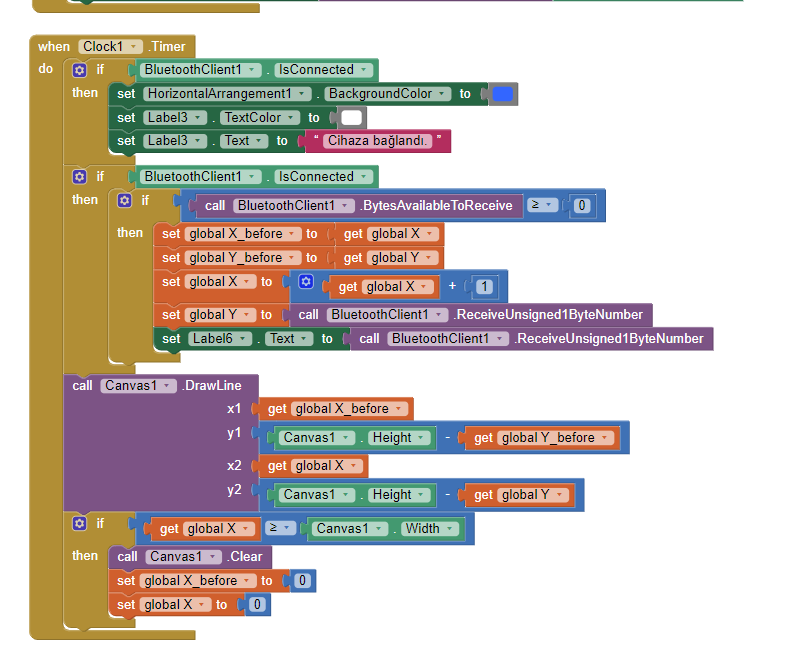
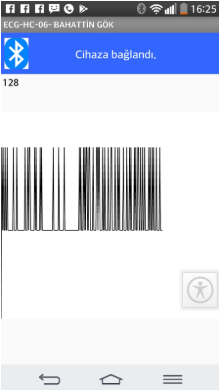
Hi again, I am new starter to mıt app, so that could be I didnt understand some point that you showed.My last post is closed. I changed code and some thing and I had like that chart.( By the way I changed signal source, firstly I try AD8232 and now I use my ECG circuit. Its chart is in post. And programm has like this chart.
Thank you all.
#include <SoftwareSerial.h>
int in = A0;
SoftwareSerial bt_connection(2, 3); // RX, TX
void setup() {
// initialize the serial communication:
Serial.begin(9600);
bt_connection.begin(9600);
pinMode(in, INPUT);
}
void loop() {
byte val =map(analogRead(in), 0,1024.0, 0, 255);
bt_connection.write(val);
delay(30);
}
Normally to be like that
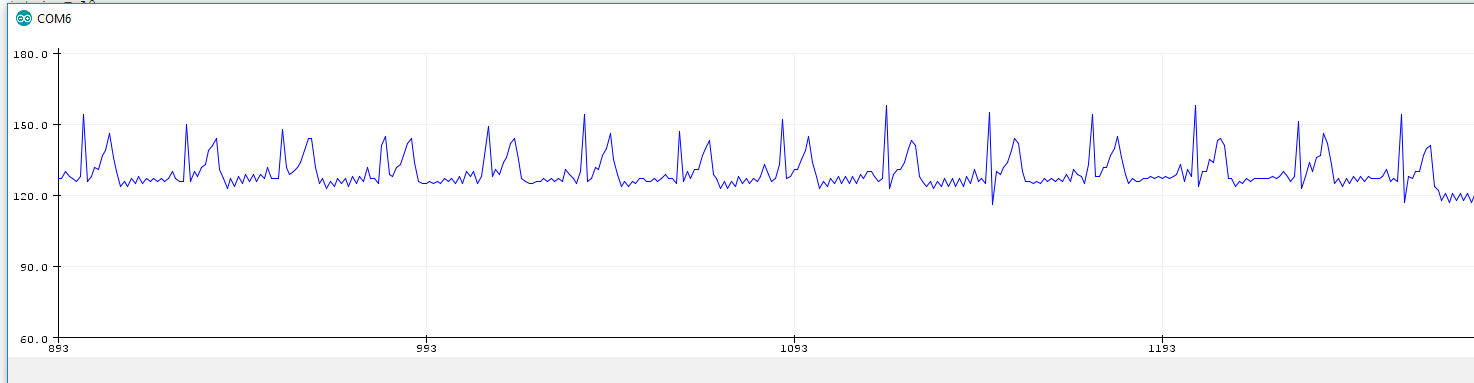
But it my chart on app seems like that
Thank you all.

SteveJG
May 12, 2019, 7:49:19 AM5/12/19
to MIT App Inventor Forum
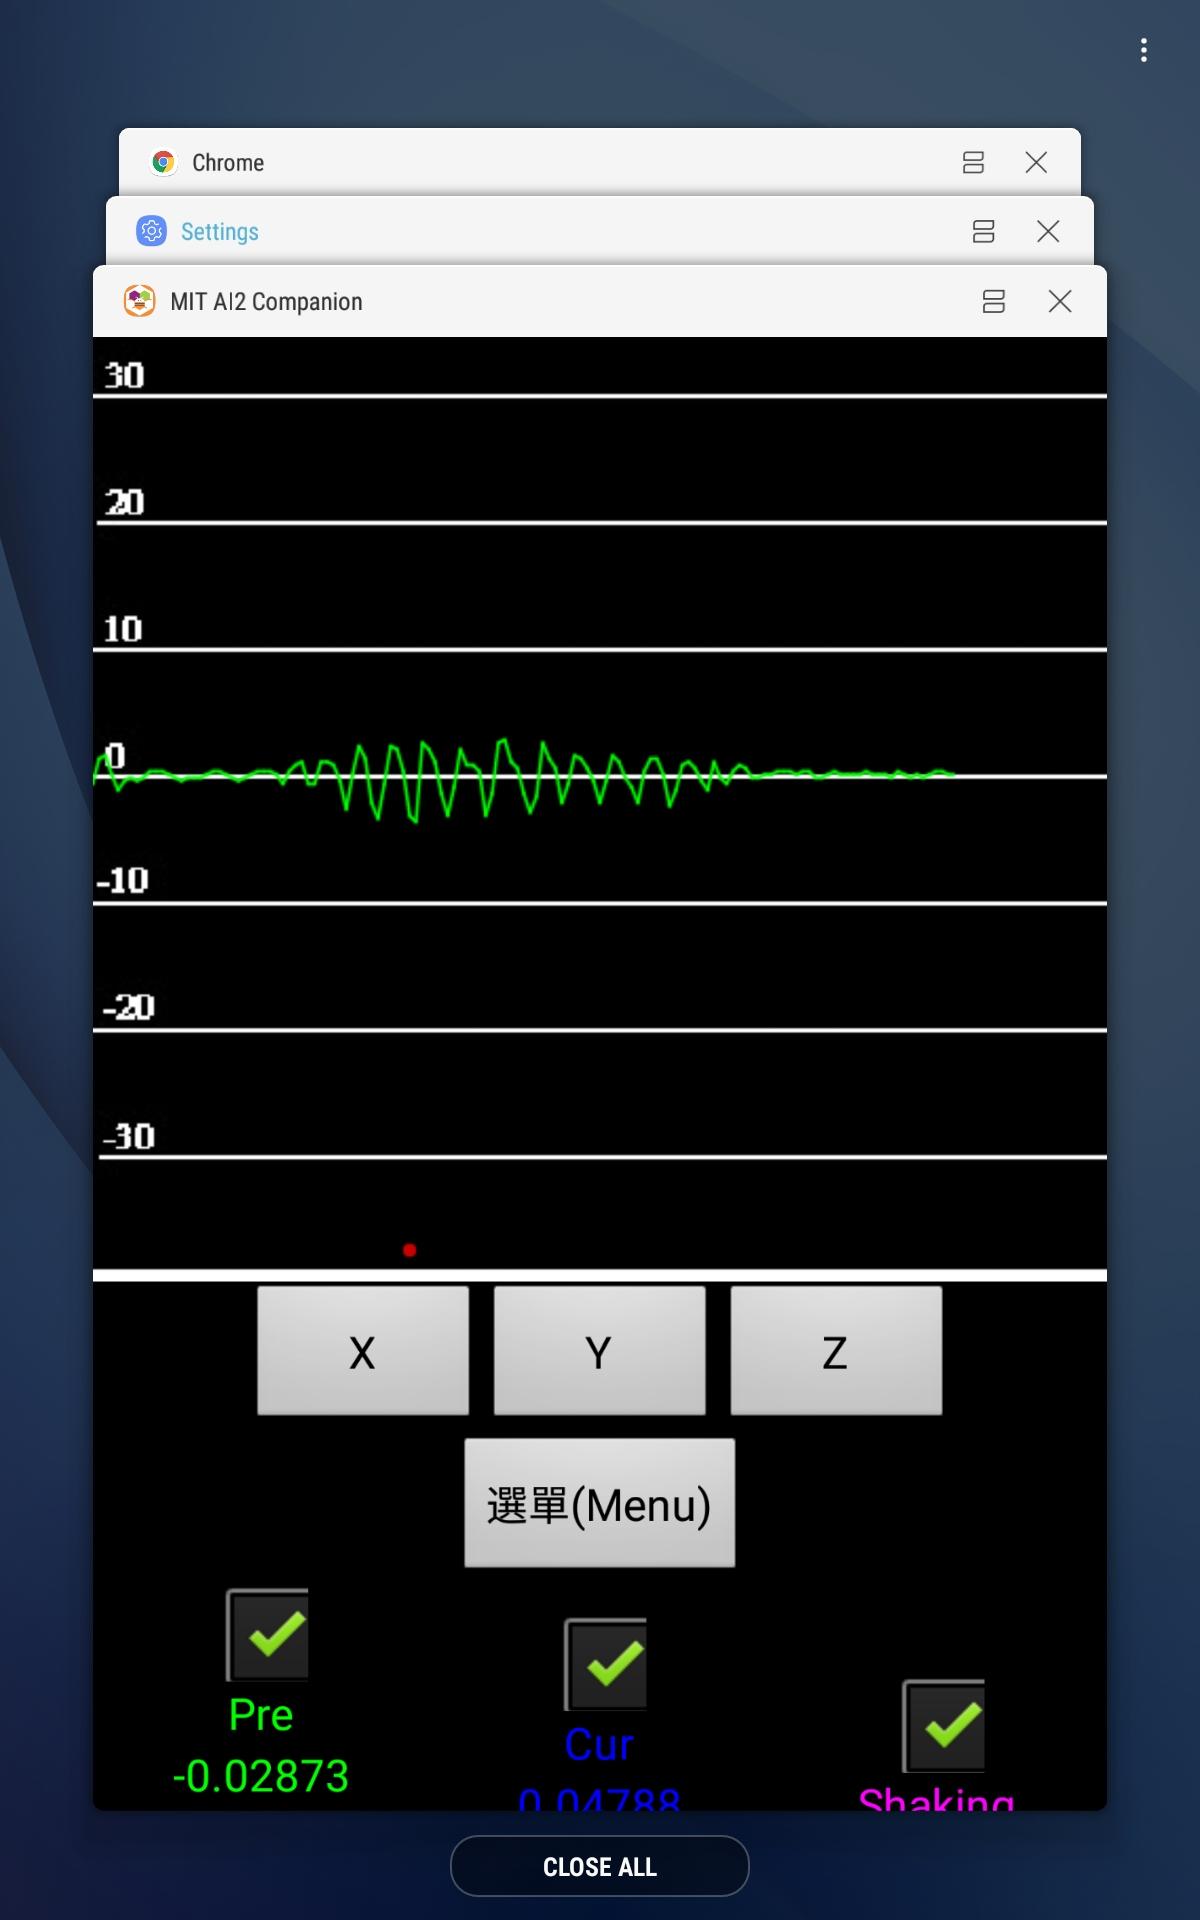
T following Forum post (making a seismograph) plots a similar data stream (look for the Accelerometer_copy_copy.aia file on ^/25/14). It shows a technique to plot using the Canvas that is scaled. You need to do something similar with your ECG data. You will have to experiment. Load the aia and see how this was done with seismic data and you should be able to do something similar.
Or you might want to use a graphing extension.
Regards,
Steve
Bahattin Gok
May 12, 2019, 12:43:37 PM5/12/19
to MIT App Inventor Forum
Hi, I searched your advice file, I found it but there is wrong. Its file code blocks empty.
SteveJG
May 13, 2019, 9:20:08 AM5/13/19
to MIT App Inventor Forum
Is this the link you found Bahattin https://groups.google.com/forum/#!msg/mitappinventortest/xXOUXOxPLZQ/9U4RWID_VX8J;context-place=msg/mitappinventortest/IheCDlPnjdc/dU1uQQoeAgAJ
The aia downloads properly here. There are two Screens ... look at the Blocks on the "graphingScreen" perhaps? You might try again.
Bahattin Gok
May 15, 2019, 9:28:35 AM5/15/19
to MIT App Inventor Forum
SteveJG
May 15, 2019, 10:19:32 AM5/15/19
to mitappinv...@googlegroups.com
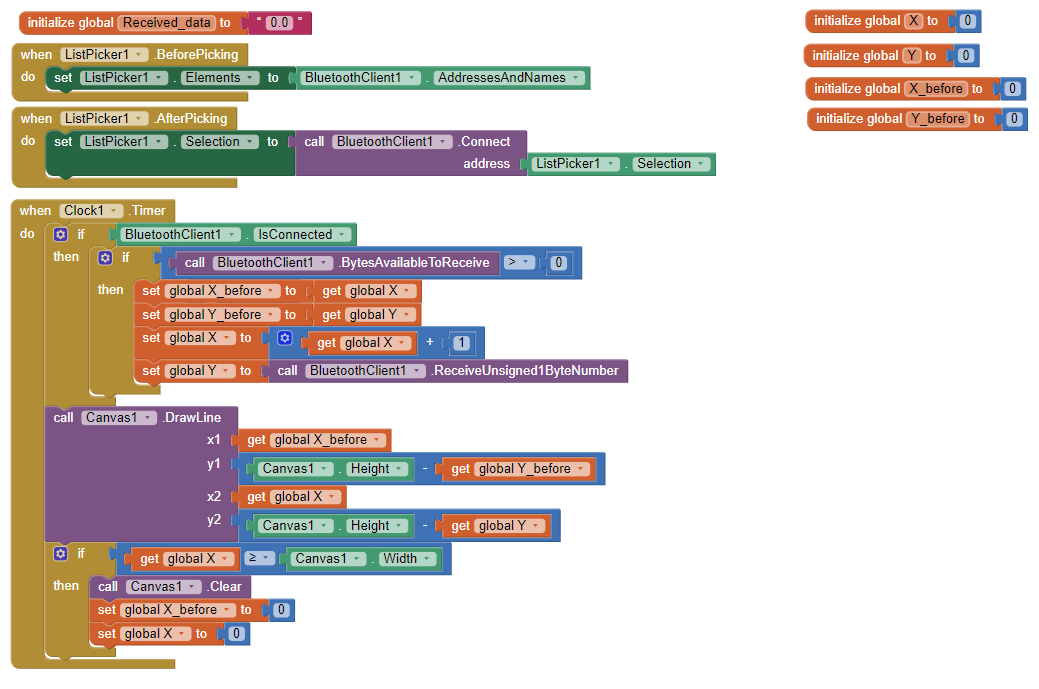
You might want to try harder Bahattin. The Blocks required to create a scaled graph on a Canvas are shown. What is shown to plot a scaled graph using the Canvas is complicated
If you want to plot your ECG to look like the example you posted in real time, you
will have to create your blocks to look something similar in your app.
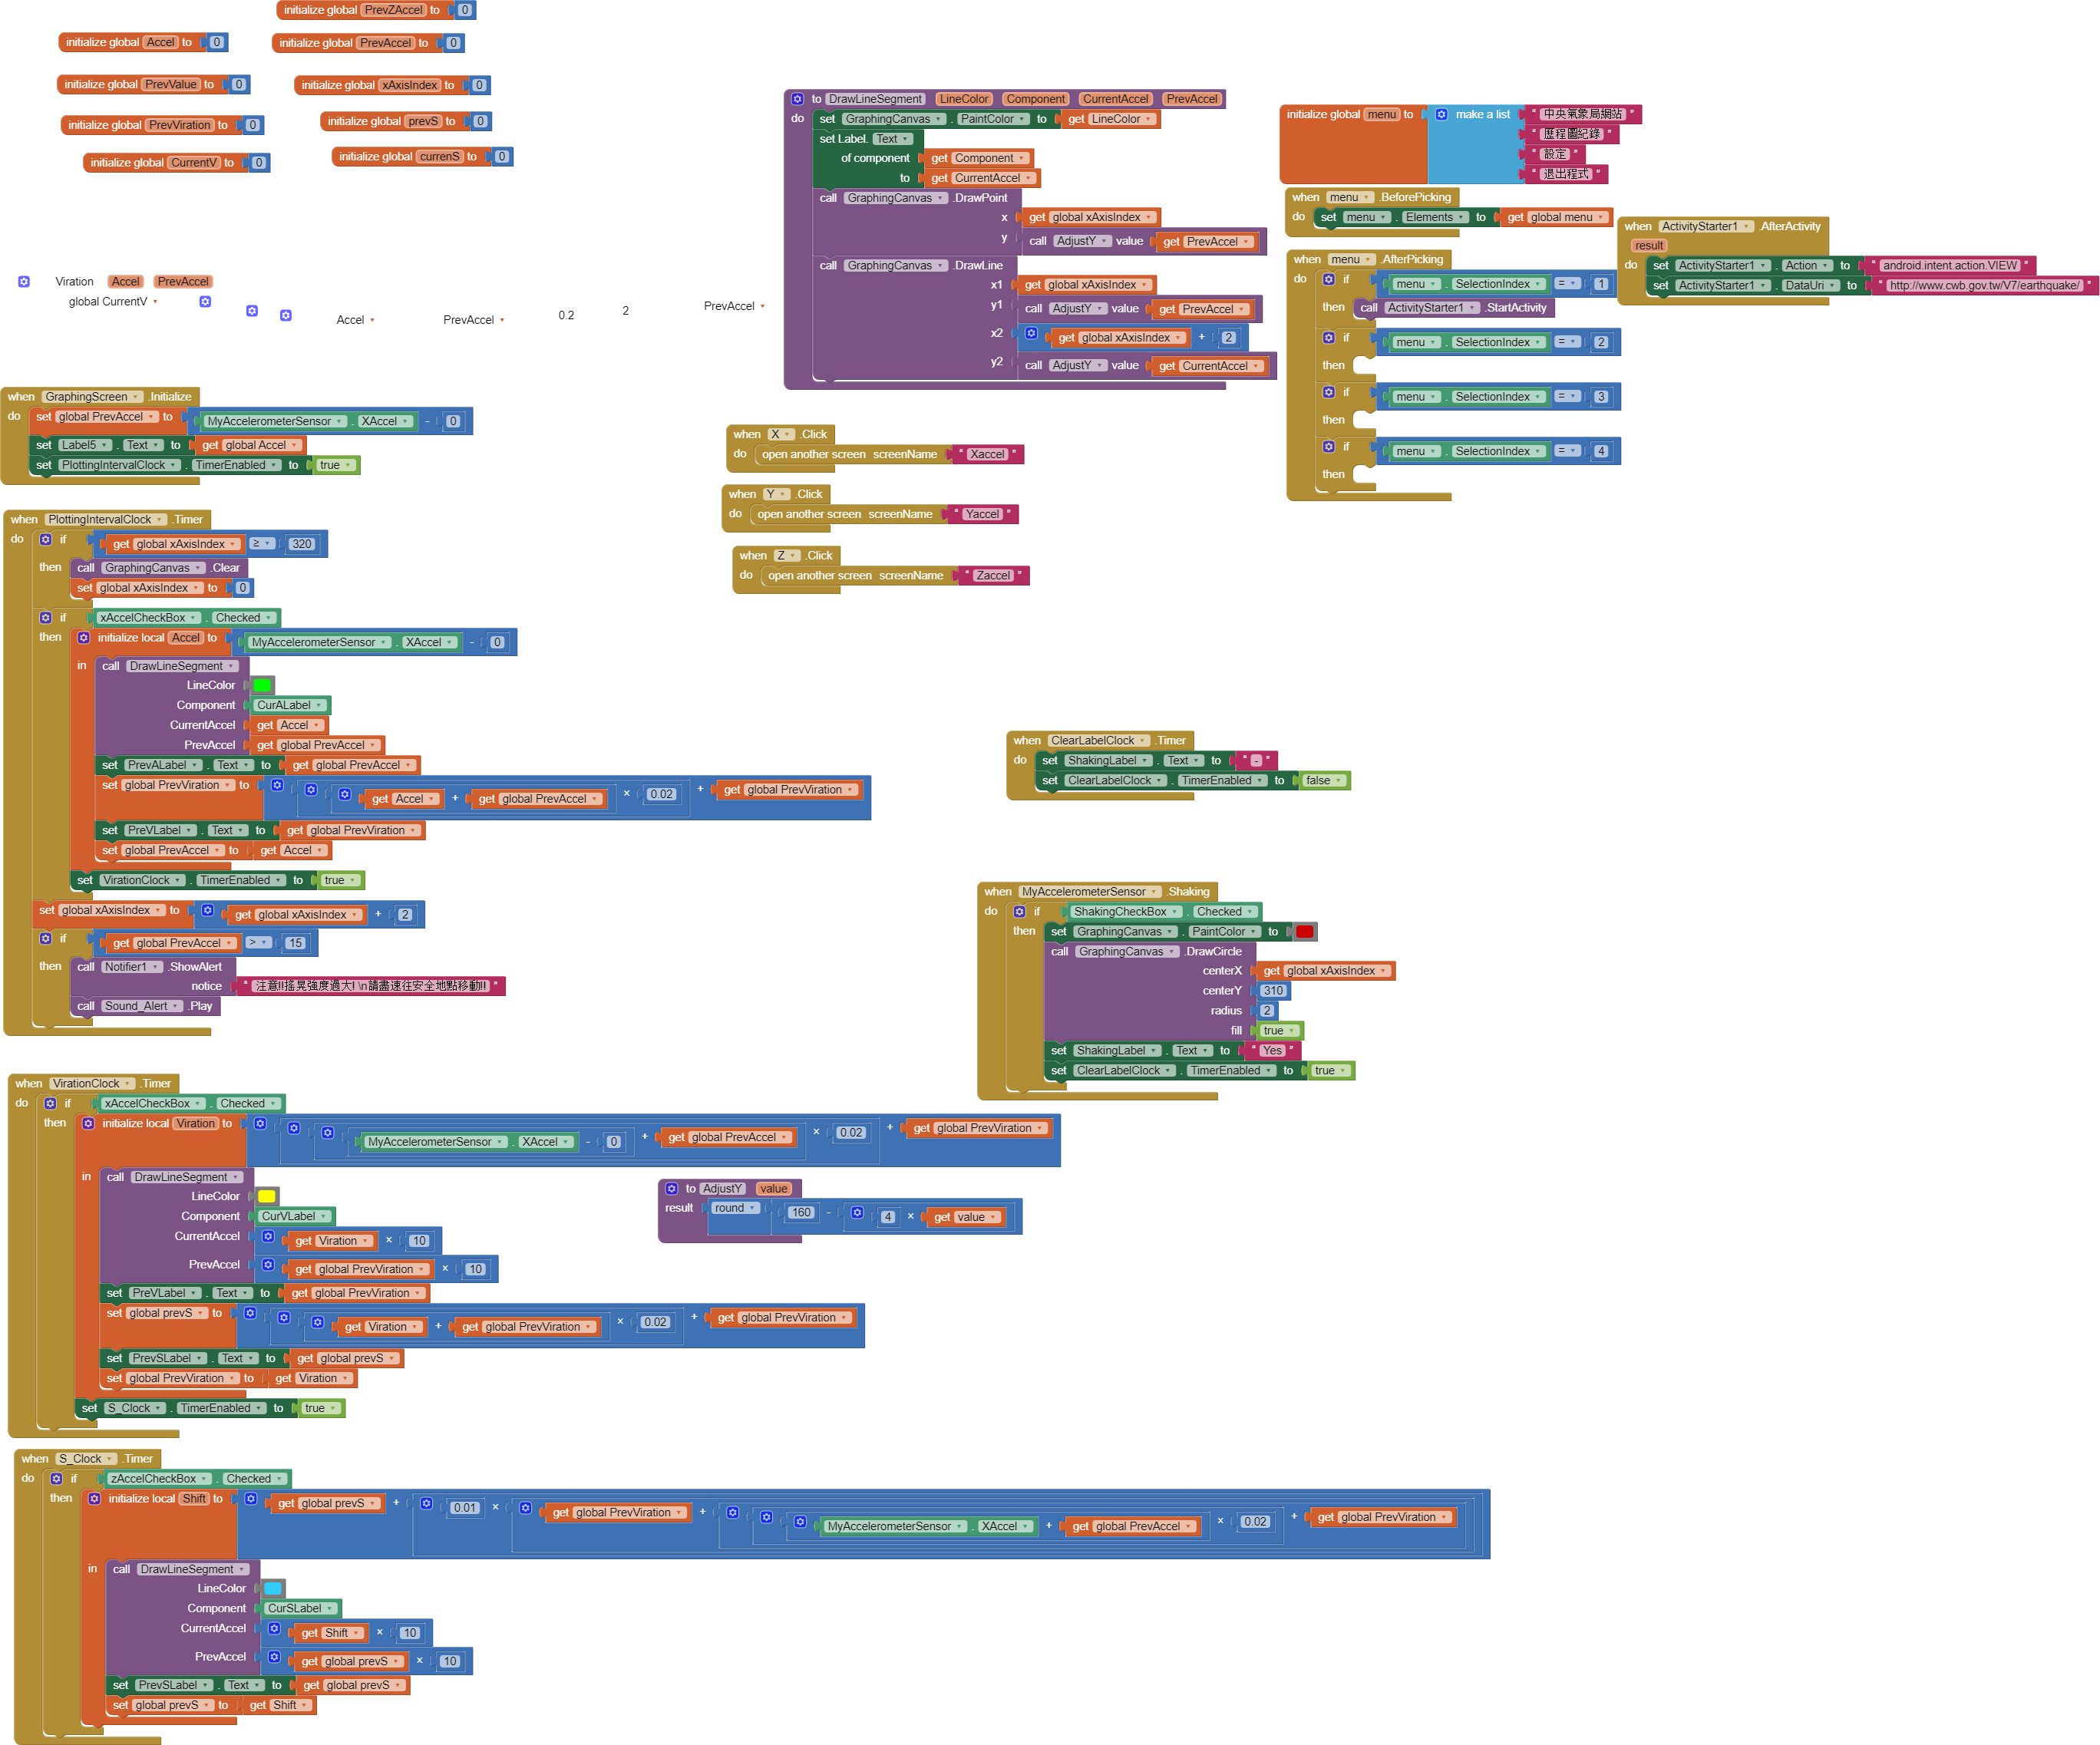
the reason your code looks the way it does is because it is NOT scaled.
SteveJG
May 15, 2019, 12:21:54 PM5/15/19
to MIT App Inventor Forum
Here is a link to a Project discussed in the Forum that is similar to your Bluetooth ECG . It uses a SCALED canvas . It may be easier to understand than the complex graphing solution.
Regards,
Steve
Reply all
Reply to author
Forward
0 new messages