Calculating incremental displacement and error bars
113 views
Skip to first unread message

sar
Feb 18, 2021, 12:26:42 AM2/18/21
to MintPy
In reading other posts, am I correct in that the results in the timeseries_ERA5_ramp_demErr.h5 file (after topo correction) are the final cumulative time-series for a dataset?
I want to show the incremental displacement at each time slice, so that would be a simple calculation of subtracting the previous time slice with the present time slice. For example, the incremental displacement for date3 is date3 - date2?
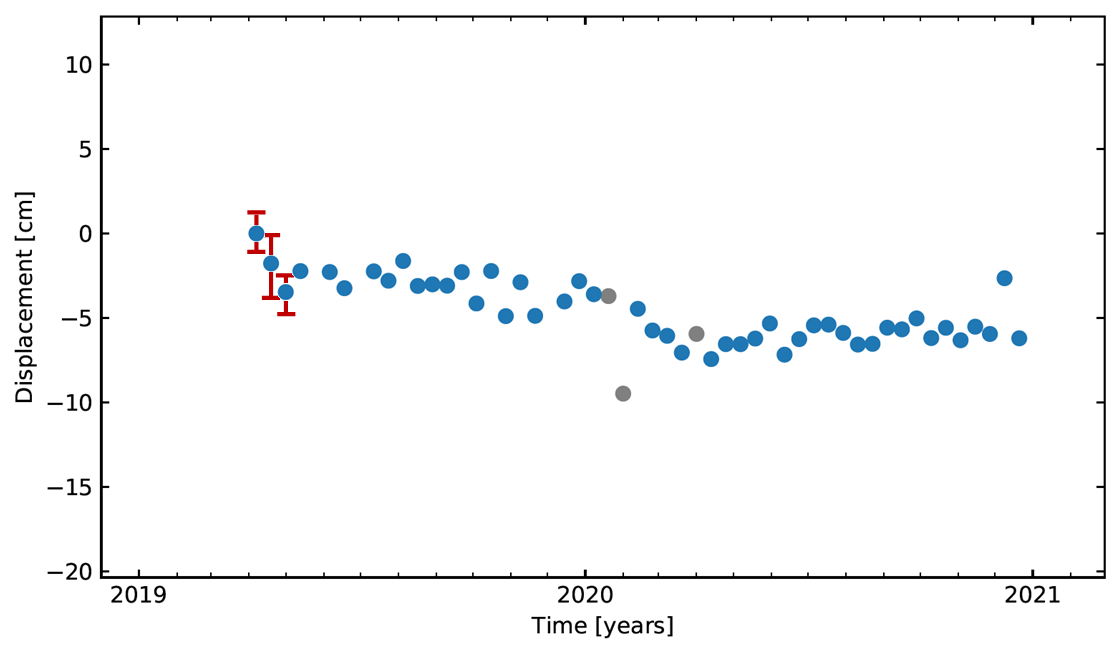
I'd also like to put error bars on my pixel plots, so I can show how confident (or not) the data results are. My statistics is a little rusty, so I'm not sure if one of the existing outputs provides the required information (eg. residual RMS), or if I need to calculate it separately. I've attached an example of what I mean.
Message has been deleted

Zhang Yunjun
Feb 28, 2021, 10:21:55 PM2/28/21
to MintPy
Hi sar,
For the differential time-series, you could try temporal_derivative.py.
MintPy does not produce uncertainty currently.
Yunjun
Reply all
Reply to author
Forward
0 new messages